Introduction
The User Guide explains how you can customize the default Hypersistence Optimizer behavior, and describes all performance-related events that are triggered while analyzing your project.
Configuring Hypersistence Optimizer
By default, Hypersistence Optimizer requires little configuration. However, as you will see in this guide, you can change the way events are propagated so that you can filter, decorate, or provide a custom exception handler.
Enabling or disabling scanners
Hypersistence Optimizer uses a mapping, a configuration, and a runtime scanner. The mapping and configuration scanners will trigger events when you create a HypersistenceOptimizer instance.
You can enable or disable any of the Hypersistence Optimizer scanners via the following methods:
setMappingScannerEnabledsetConfigurationScannerEnabledsetRuntimeScannerEnabled
There’s also a setMetadataScannersEnabled method that simply calls the setMappingScannerEnabled and setConfigurationScannerEnabled methods with the given parameter value.
When the configuration scanner runs, Hypersistence Optimizer also reads the database catalog (e.g., the column types, the Primary Keys, the indexes, and the sequences of the mapped tables) and the database server settings, so that it can cross-check them with your entity mappings and configuration. These checks run a few read-only queries when Hypersistence Optimizer is bootstrapped. If the database user cannot read the catalog or the server settings, or if you don’t want Hypersistence Optimizer to query your database, you can disable them using the setDatabaseScannerEnabled method:
new JpaConfig(entityManagerFactory)
    .setDatabaseScannerEnabled(false)
Reading the database catalog takes a few metadata queries per mapped table. To avoid delaying the application bootstrap when the schema is very large, Hypersistence Optimizer stops reading the catalog after 10 seconds (a time budget you can change, as explained in the Thresholds section) and logs a warning telling how many tables were skipped, while the database schema checks still run for the tables whose catalog was read. If you want to check all the tables without delaying the bootstrap, you can run the configuration scanner asynchronously, as explained next.
The database server checks report the server settings left at their factory defaults (e.g., the PostgreSQLSharedBuffersEvent, the MySQLBufferPoolSizeEvent, or the SqlServerReadCommittedSnapshotEvent). If you run Hypersistence Optimizer in integration tests that use a throwaway database (e.g., a Testcontainers database), these events describe the test database, not your production one. In this case, you can either disable the database scanner for the integration tests or ignore the
DatabaseServerEventevents, all of which extend theio.hypersistence.optimizer.jdbc.event.server.DatabaseServerEventbase class, as explained in the How to trigger a build failure when detecting any performance issue section.
By default, the mapping and configuration scanners run when the HypersistenceOptimizer is instantiated, so the application bootstrap waits for them to analyze the entity mappings, the configuration, and the database. If you don’t want Hypersistence Optimizer to add any overhead to the application bootstrap, you can run them asynchronously using the setAsyncMetadataScannersEnabled method:
new JpaConfig(entityManagerFactory)
    .setAsyncMetadataScannersEnabled(true)
In this case, the bootstrap and runtime scanners still run synchronously, so the runtime checks are enabled before your application starts using the SessionFactory, while the mapping scanner and the configuration scanner run in two background threads, named hypersistence-optimizer-mapping-scanner and hypersistence-optimizer-configuration-scanner.
Because the mapping and configuration events are triggered after the HypersistenceOptimizer is instantiated, you can use the awaitMetadataScanners method if you need to wait for them, like in an integration test that checks the triggered events:
HypersistenceOptimizer hypersistenceOptimizer = new HypersistenceOptimizer(
    new JpaConfig(entityManagerFactory)
        .setAsyncMetadataScannersEnabled(true)
);

assertTrue(hypersistenceOptimizer.awaitMetadataScanners(1, TimeUnit.MINUTES));
List<Event> events = hypersistenceOptimizer.getEvents();
So, if you want to disable the mapping and configuration scanners because you are always recreating the
HypersistenceOptimizerinstance in every integration test, then you can use thesetMetadataScannersEnabledmethod of the associatedJpaConfigorHibernateConfigobjects.
HypersistenceOptimizer hypersistenceOptimizer = new HypersistenceOptimizer(
    new JpaConfig(entityManagerFactory)
        .setMetadataScannersEnabled(false)
);
EventHandler
The EventHandler allows you to customize the way events are processed by Hypersistence Optimizer. For instance, by default, all events are logged by the LogEventHandler instance.
Collecting events
By default, all events are collected automatically via an internal ListEventListener, and you can access the recorded events like this:
List<Event> events = hypersistenceOptimizer.getEvents();
By default, only 25k events are collected, but you can configure this threshold via the
hypersistence.max_event_sizeconfiguration property. After themax_event_sizethreshold is reached, the oldest entries are going to be removed to ensure the event list doesn’t grow indefinitely.
If you are using Spring Boot, you can change the default value of this property in the application.properties file:
spring.jpa.properties.hypersistence.max_event_size=10000
If you are bootstrapping JPA using the persistence.xml configuration file, then you can set
the hypersistence.max_event_size configuration property like this:
<properties>
    ...
    <property name="hypersistence.max_event_size" value="10000"/>
</properties>
You can also set this property programmatically using the Config object when instantiating a new Hypersistence Optimizer instance:
new HypersistenceOptimizer(
    new JpaConfig(entityManagerFactory())
        .setProperties(
            Map.of(
                Config.Property.MAX_EVENT_SIZE, 10000
            )
        )
);
Adding a new EventHandler
If you want to add a new event handler, you can use the addEventHandler method:
List<String> tipsUrls = new ArrayList<>();

new HypersistenceOptimizer(
    new JpaConfig(entityManagerFactory())
        .addEventHandler(
            event -> {
                tipsUrls.add(event.getInfoUrl());
            }
        )
);

assertEquals(1, tipsUrls.size());
If you want to test this functionality, check out the
AddEventHandlerTestin thehypersistence-optimizerGitHub repository.
EventFilter
The EventFilter allows you to accept or reject certain events that your not interested in capturing and propagating. For instance, if you’re using MySQL, using the IDENTITY identifier generator is the only reasonable option.
However, you might want to reject the IdentityGeneratorEvent that is associated with the IDENTITY generator, therefore preventing it from propagating further.
To do so, you need to provide a custom EventFilter as in the following example:
new HypersistenceOptimizer(
    new JpaConfig(entityManagerFactory())
        .setEventFilter(
            event -> !(event instanceof IdentityGeneratorEvent)
        )
);
Notice the setEventFilter method call that passes a custom EventFilter to the current Hypersistence Optimizer configuration.
If you want to test this functionality, check out the
EventFilterTestin thehypersistence-optimizerGitHub repository.
How to trigger a build failure when detecting any performance issue
Now, one of the best things that Hypersistence Optimizer gives you is the ability to automatically detect JPA and Hibernate performance issues.
While you can always review the report generated by Hypersistence Optimizer, it’s even better if, after you fixed all issues, any data access code change that could introduce a performance-related issue be detected prior to pushing changes to production.
All you need to do is assert that no events are generated, as illustrated by the following code snippet:
@Test
public void testNoPerformanceIssues() {
    HypersistenceOptimizer hypersistenceOptimizer = new HypersistenceOptimizer(
        new JpaConfig(entityManagerFactory())
    );
    assertTrue(hypersistenceOptimizer.getEvents().isEmpty());
}
That’s it!
If any event is generated by Hypersistence Optimizer, the build will fail, and you’ll get instant notification of the performance-related issues that were introduced by the latest code changes.
Some checks report the environment the test runs in, rather than your code: the database server settings (the
io.hypersistence.optimizer.jdbc.event.server.DatabaseServerEventevents), the JDBC Driver properties (theio.hypersistence.optimizer.jdbc.event.JdbcDriverEventevents), and the connection pool settings (theio.hypersistence.optimizer.jdbc.event.pool.ConnectionPoolEventevents). For instance, a Testcontainers database uses the server defaults, and a testDataSourcemight not set the socket timeout or the application name that your production one sets.If your test environment differs from the production one, you can exclude these events from the test using an EventFilter:
new HypersistenceOptimizer(
    new JpaConfig(entityManagerFactory())
        .setEventFilter(
            event -> !(event instanceof DatabaseServerEvent) &&
                !(event instanceof JdbcDriverEvent) &&
                !(event instanceof ConnectionPoolEvent)
        )
);
Also, a new Hypersistence Optimizer version can add new checks, so, after an upgrade, this test can fail even if your code hasn’t changed. In this case, check the new events in the report, and either fix the issues or exclude the events you don’t want to address.
Thresholds
Some checks compare your application settings against a threshold (e.g., the maximum recommended connection pool size, or the maximum number of elements a query can return). The default thresholds suit most applications, but you can adapt them to your workload (e.g., a reporting application that legitimately fetches 10000 rows, or a connection pool sized for a large database server) using the io.hypersistence.optimizer.core.config.ConfigThresholds builder:
new HypersistenceOptimizer(
    new JpaConfig(entityManagerFactory())
        .setThresholds(
            ConfigThresholds.builder()
                .setQueryMaxResultSize(1000)
                .setConnectionPoolMaxSize(50)
                .build()
        )
);
Every threshold can also be set via a hypersistence.* configuration property, which takes precedence over the value set via the ConfigThresholds builder:
| Property | ConfigThresholds.Builder method |
Default | Events |
|---|---|---|---|
hypersistence.session.timeout_millis |
setSessionTimeoutMillis |
3000 |
SessionTimeoutEvent |
hypersistence.session.flush_timeout_millis |
setSessionFlushTimeoutMillis |
1000 |
SessionFlushTimeoutEvent |
hypersistence.query.max_result_size |
setQueryMaxResultSize |
100 |
QueryResultListSizeEvent, QueryResultIteratorCountEvent, QueryResultScrollableCountEvent, QueryResultStreamCountEvent |
hypersistence.query.timeout_millis |
setQueryTimeoutMillis |
250 |
QueryTimeoutEvent |
hypersistence.jdbc.statement_cache_size |
setStatementCacheSize |
256 |
JdbcStatementCacheSizeEvent |
hypersistence.jdbc.statement_cache_sql_limit |
setStatementCacheSqlLimit |
2048 |
JdbcStatementCacheSqlLimitEvent |
hypersistence.jdbc.open_cursors_headroom |
setOpenCursorsHeadroom |
10 |
OracleOpenCursorsEvent, JdbcStatementCacheSizeEvent |
hypersistence.connection_pool.max_size |
setConnectionPoolMaxSize |
30 |
ConnectionPoolSizeEvent |
hypersistence.connection_pool.max_connections_percentage |
setConnectionPoolMaxConnectionsPercentage |
50 |
ConnectionPoolMaxConnectionsEvent |
hypersistence.connection_pool.max_prepared_statements_percentage |
setConnectionPoolMaxPreparedStatementsPercentage |
50 |
MySQLMaxPreparedStatementCountEvent |
hypersistence.sequence.min_cache_size |
setSequenceMinCacheSize |
20 |
SequenceCacheSizeEvent |
hypersistence.database_scanner.catalog_time_budget_millis |
setDatabaseCatalogTimeBudgetMillis |
10000 |
The time budget for reading the database catalog of the mapped tables |
A threshold must be an integer greater than 0, and a percentage must not be greater than 100. The ConfigThresholds builder throws an IllegalArgumentException for an invalid value, while an invalid property value (e.g., 0, -1, 12.5, or 150 for a percentage) is logged as an error and ignored. If you want to disable a check, use an EventFilter instead.
The Persistence Context and query thresholds (hypersistence.session.timeout_millis, hypersistence.session.flush_timeout_millis, hypersistence.query.max_result_size, and hypersistence.query.timeout_millis) are the exception, since they are also runtime properties. Their values are read every time a Persistence Context or a query runs, so they can be set per EntityManager or Query, as explained in the runtime configuration properties section, and, for backward compatibility, a value of 0 disables the associated check for the Persistence Context or the query it applies to. For these four thresholds, Config#getThresholds returns the value that applies when the runtime property is not set.
The other thresholds are used by the configuration and database checks, which run when Hypersistence Optimizer is bootstrapped. Therefore, changing their properties afterward (e.g., using the JMX setProperty method) has no effect on the checks that already ran.
The events that compare a setting against a threshold expose it via a getter (e.g.,
ConnectionPoolSizeEvent#getMaxRecommendedPoolSize), and their description uses the configured value.If you want to test this functionality, check out the
ConfigThresholdsTestin thehypersistence-optimizerGitHub repository.
Runtime configuration properties
Hypersistence Optimizer offers a flexible mechanism for providing runtime configurations, on a per-EntityManagerFactory, EntityManager, or Query basis.
Any mechanism that allows you to configure JPA and Hibernate properties can also be used to set the Hypersistence
Configproperties.
Configuring the runtime properties using the persistence.xml file
If you are bootstrapping JPA using the persistence.xml configuration file, then you can provide
the Hypersistence Optimizer runtime properties via the properties XML tag:
<properties>
    ...
    <property name="hypersistence.session.timeout_millis" value="250"/>
    <property name="hypersistence.session.flush_timeout_millis" value="100"/>
    <property name="hypersistence.query.max_result_size" value="50"/>
</properties>
Configuring the runtime properties using the application.properties file
If you are using Spring Boot, you can set the Hypersistence runtime properties just like you do with the Hibernate configuration properties.
Therefore, if you add the following entry in the application.properties file:
spring.jpa.properties.hypersistence.session.timeout_millis=250
spring.jpa.properties.hypersistence.session.flush_timeout_millis=100
spring.jpa.properties.hypersistence.query.max_result_size=50
Hypersistence Optimizer is going to trigger a runtime event in the following situations:
- The JPA
EntityManageror HibernateSessionruns for more than 250 milliseconds - The JPA
EntityManageror HibernateSessionflush runs for more than 100 milliseconds - A
Queryreturns aListwith more than 50 elements.
Configuring the runtime properties when instantiating Hypersistence Optimizer
You can set the Hypersistence runtime properties programmatically using the Config object when instantiating a new Hypersistence Optimizer instance:
new HypersistenceOptimizer(
    new JpaConfig(entityManagerFactory())
        .setProperties(
            Map.of(
                Config.Property.Session.TIMEOUT_MILLIS, 250,
                Config.Property.Session.FLUSH_TIMEOUT_MILLIS, 100,
                Config.Property.Query.MAX_RESULT_SIZE, 50
            )
        )
);
The
HypersistenceOptimizerprogrammatically-configured properties take precedence over the ones passed via JPA or Hibernate properties.
Configuring the runtime properties using the JPA EntityManager
If you’re using Hibernate ORM 5.2.8 or newer, you can also use the JPA EntityManager setProperty method to override a default Hypersistence property value, as well as properties defined via the EntityManagerFactory or HypersistenceOptimizer configuration:
entityManager.setProperty(
    Config.Property.Session.TIMEOUT_MILLIS,
    250
);

entityManager.setProperty(
    Config.Property.Session.FLUSH_TIMEOUT_MILLIS,
    100
);

entityManager.setProperty(
    Config.Property.Query.MAX_RESULT_SIZE,
    50
);
Configuring the runtime Query properties using the JPA Query hints
If you’re using Hibernate ORM 5.2 or newer, you can also use the JPA Query setHint method to override the default Hypersistence query property value, as well as the ones defined via the EntityManagerFactory, SessionFactory, EntityManager or HypersistenceOptimizer configuration:
List<Post> posts = entityManager.createQuery("""
    select p
    from Post p
    where p.createdOn >= :today
    order by p.id
    """, Post.class)
.setParameter(
    "today",
    Timestamp.valueOf(
        LocalDate.now().atStartOfDay()
    )
)
.setHint(Config.Property.Query.MAX_RESULT_SIZE, 50)
.getResultList();
Configuring the runtime Query properties using the Hibernate Query comment
You can also use the Hibernate Query setComment method to override the default Hypersistence query property value, as well as the ones defined via the EntityManagerFactory, SessionFactory, EntityManager or HypersistenceOptimizer configuration:
List<Post> posts = entityManager.createQuery("""
    select p
    from Post p
    where p.createdOn >= :today
    order by p.id
    """, Post.class)
.setParameter(
    "today",
    Timestamp.valueOf(
        LocalDate.now().atStartOfDay()
    )
)
.unwrap(org.hibernate.query.Query.class)
.setComment(
    new Config.Property.Stringifier()
        .put(Config.Property.Query.MAX_RESULT_SIZE, 10)
        .toString()
)
.getResultList();
Notice that we used the
Config.Property.Stringifierutility, supplied by Hypersistence Optimizer, to transform theMap-based properties to theirStringrepresentation that can be passed to the current HibernateQueryvia thecommentmechanism, and further used by Hypersistence Optimizer to override theQueryruntime properties.
JMX
Hypersistence Optimizer provides support for JMX. By default, the JMX integration is disabled, and, to enable it, you need to set the JMX configuration, like this:
new HypersistenceOptimizer(
    new JpaConfig(entityManagerFactory())
        .setJmx(
            new Config.Jmx("Billing")
        )
);
The Config.Jmx object requires a unique Persistence Unit name, which is going to be used to export the MBean that gives you access to the generated events and the runtime properties.
Getting the events using JMX
Once you enabled the JMX integration, you can get access to the generated events, as illustrated by the following screen capture:

Getting and setting the runtime properties using JMX
You can also read or write the runtime properties (e.g., hypersistence.query.max_result_size) using the getProperty or setProperty methods of the JMX bean, as illustrated by the following screen capture:

Event Persistence Web App
When the Event Persistence feature is enabled (see the Installation Guide for how to enable and configure it), Hypersistence Optimizer stores the detected events in the database. The Event Persistence Web App is a lightweight, dependency-free web application that visualizes those events, so you can see how the number of issues evolves over time as you apply optimizations.
Event persistence is available on Hibernate 3.3+ with an identity-capable database and dialect and JDBC generated-key support. During Optimizer bootstrap, the default schema strategy creates missing tables directly from the host dialect over JDBC, without building another SessionFactory or touching shared cache-manager lifecycle. Hibernate 5.0+ can fall back to an isolated, temporary SessionFactory if this strategy fails; Hibernate 3.x and 4.x cannot. If the dialect lacks identity support, persistence is disabled unless that fallback resolves an identity-capable dialect.
The default CREATE action creates missing tables, not migrations for existing tables. VALIDATE checks table existence only, not columns, types, or indexes, while NONE skips all schema work. Schema failures are logged and disable persistence without breaking the host application. The three event tables, generated keys, and web app behavior are unchanged.
Starting the web app
There are two ways to run the web app: embedded inside your application (the simplest, recommended for getting started and for local testing) or as a standalone process (best for a shared, always-on instance an operator opens from their own machine).
Embedded in your application
The easiest way to access the web app is to let the Optimizer start it for you, inside the same application. Because it is bundled in the hypersistence-optimizer jar and reuses the Optimizer’s Hibernate SessionFactory, there is nothing to deploy and no database coordinates to configure — just enable it on the Config.EventPersistence:
new Config.EventPersistence()
    .setEnabled(true)
    .setApplicationName("my-app")
    .setWebAppEnabled(true)
When the application starts, the web app URL is printed in the log:
Hypersistence Optimizer web app is available at http://localhost:53124/
By default it binds a dynamically-allocated free port on localhost. Since the port is dynamic, you can also read the URL back from the optimizer (handy for logging it through your own framework or exposing it via a management endpoint), or pin a fixed port with setWebAppPort(8088):
String webAppUrl = optimizer.getWebAppUrl(); // e.g. http://localhost:53124/
The setWebAppEnabled(true) setting only controls whether the web app starts automatically when the Optimizer bootstraps. If you would rather not keep it running all the time, leave it disabled and start it on demand (for example, from a management endpoint), and stop it once you are done. It uses the same host, port, and Basic authentication settings, and the event persistence feature keeps running either way:
optimizer.startWebApp();
String webAppUrl = optimizer.getWebAppUrl();
// ...
optimizer.stopWebApp();
See the Event Persistence section of the Installation Guide for all the embedded web app settings (port, host, and Basic authentication). Open the logged URL in your browser to access the views described below.
Standalone process
The web app can also be run as a separate process from the standalone module (hypersistence-optimizer-webapp). It is read-only and connects directly to the database where the events were stored, so it can run either next to your application or on a separate machine (e.g., an operator’s laptop).
Run it as a standalone process, passing the JDBC coordinates of the event database on the classpath together with the JDBC driver:
java -cp "hypersistence-optimizer-webapp.jar:postgresql.jar" \
    io.hypersistence.optimizer.webapp.WebAppLauncher \
    --jdbc-url jdbc:postgresql://localhost:5432/app \
    --jdbc-user app --jdbc-password secret \
    --host localhost --port 8088
On Windows, separate the classpath entries with ; instead of :.
The recognized arguments are:
| Argument | Description |
|---|---|
--jdbc-url |
The JDBC URL of the event database (required). |
--jdbc-user |
The database user (optional). |
--jdbc-password |
The database password (optional). |
--host |
The bind address (default localhost). |
--port |
The HTTP port. Use 0 (the default) to bind a dynamic port. |
--auth-user, --auth-password |
Enable optional HTTP Basic authentication. |
Once started, the web app prints the URL to load in the log:
Hypersistence Optimizer Web App available at http://localhost:8088/
Open that URL in your browser to access the web app.
The standalone server can also be started programmatically from your own code, against an explicit JDBC URL, using the
WebAppServerclass (this is independent of the Optimizer-managed web app described above):WebAppServer server = new WebAppServer( new WebAppConfig() .setJdbcUrl("jdbc:postgresql://localhost:5432/app") .setJdbcUser("app").setJdbcPassword("secret") .setPort(8088) ).start(); // ... server.stop();
The Timeline view
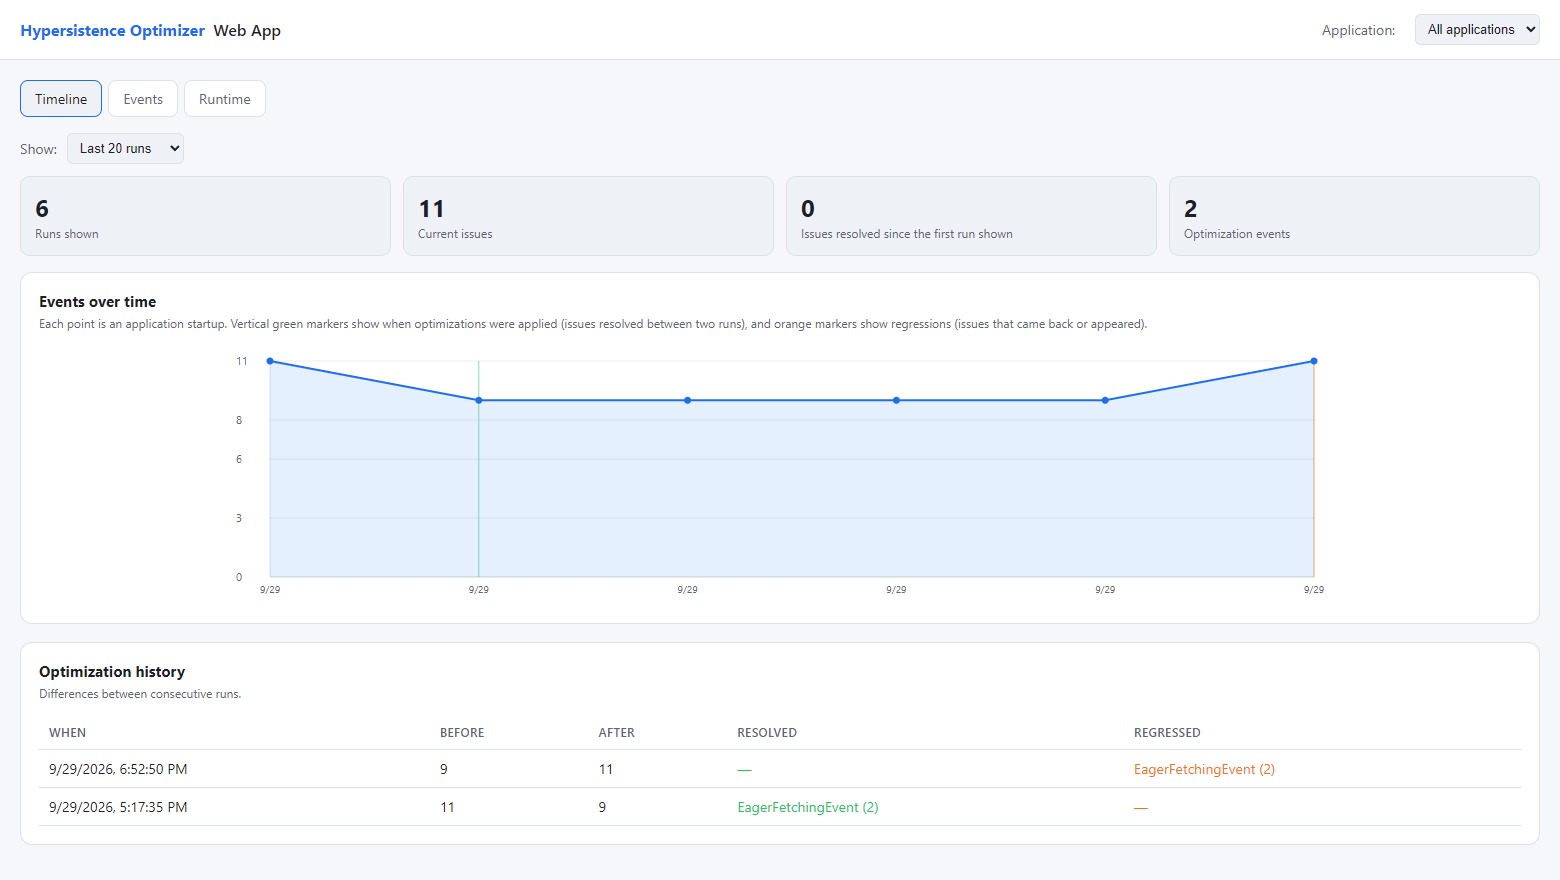
The Timeline view shows how the number of detected issues evolves across application startups. Each point on the Events over time chart is one application startup (a run), the vertical green markers show when optimizations were applied (that is, when issues present in one run are absent in the next), and the vertical orange markers show regressions (that is, when a run detects issues that were absent in the previous one).
The Optimization history table below the chart lists, for each pair of consecutive runs, which issues were resolved and which ones regressed, so you get the “100 issues down to 50 issues after an optimization session” story automatically, without recording anything manually. An issue is identified by its event type and description, so fixing one of several issues of the same type, like one of the many eagerly fetched associations, is reported as well. Hover over a cell to see the descriptions of the resolved or regressed issues.
By default, the view shows the last 20 runs, and you can choose to show the last 10, 50, or 100 runs, or all of them. Since comparing two runs loads all their events, limiting the number of runs keeps the view fast for applications that have been restarted many times.
The Events view
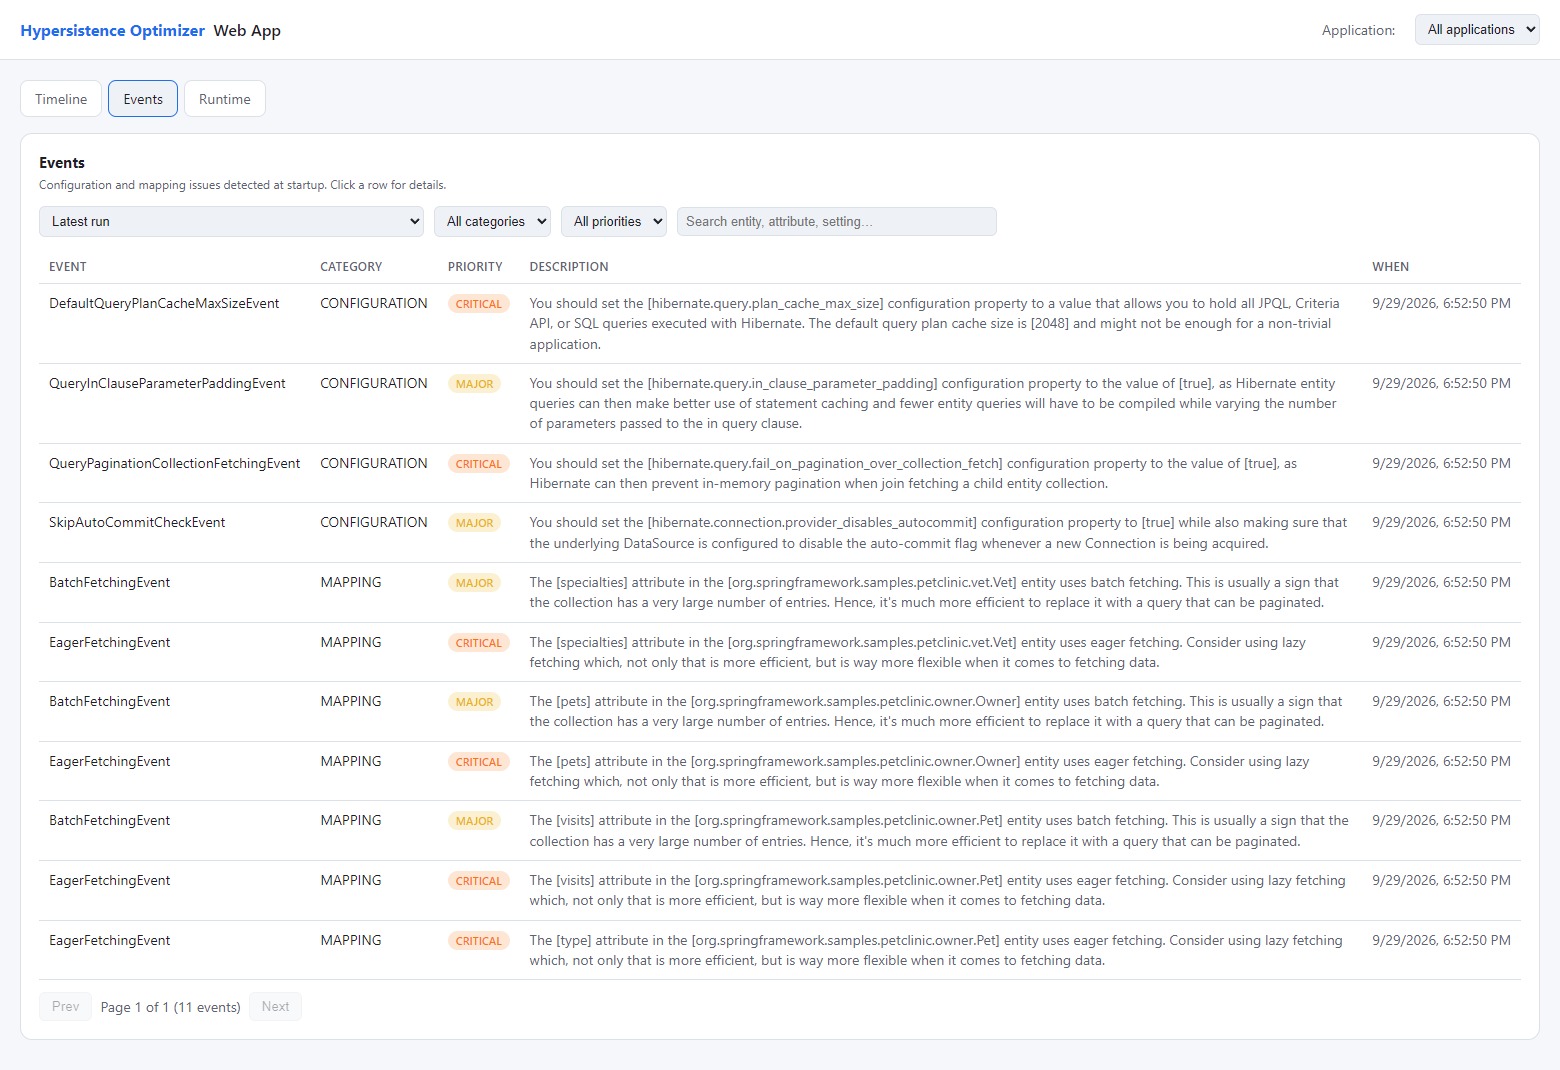
The Events view is a paginated, filterable table of the configuration and mapping issues detected at startup. Since every startup records its issues again, the view shows the issues of the latest run by default, and you can pick one of the previous runs or all runs instead. You can also filter by category (configuration or mapping) and by priority (blocker, critical, major, minor), and search for a text contained in the event name or description, like an entity or attribute name. Each row shows the event name, category, priority, description and the moment it was recorded. The event’s documentation link (explaining how to optimize the issue) is derived from the event name.
Searching the events of all runs scans the description of every recorded event. On SQL Server, the JDBC driver sends the
Stringbind parameters asNVARCHARby default, so the database has to convert everyVARCHARdescription before matching it, and the search can take several seconds when many events have been recorded. To avoid this conversion, set thesendStringParametersAsUnicodeJDBC configuration property tofalse, as explained by the SqlServerSendStringParametersAsUnicodeEvent, which also speeds up the queries of your application that bindStringparameters toVARCHARcolumns.
The Runtime view
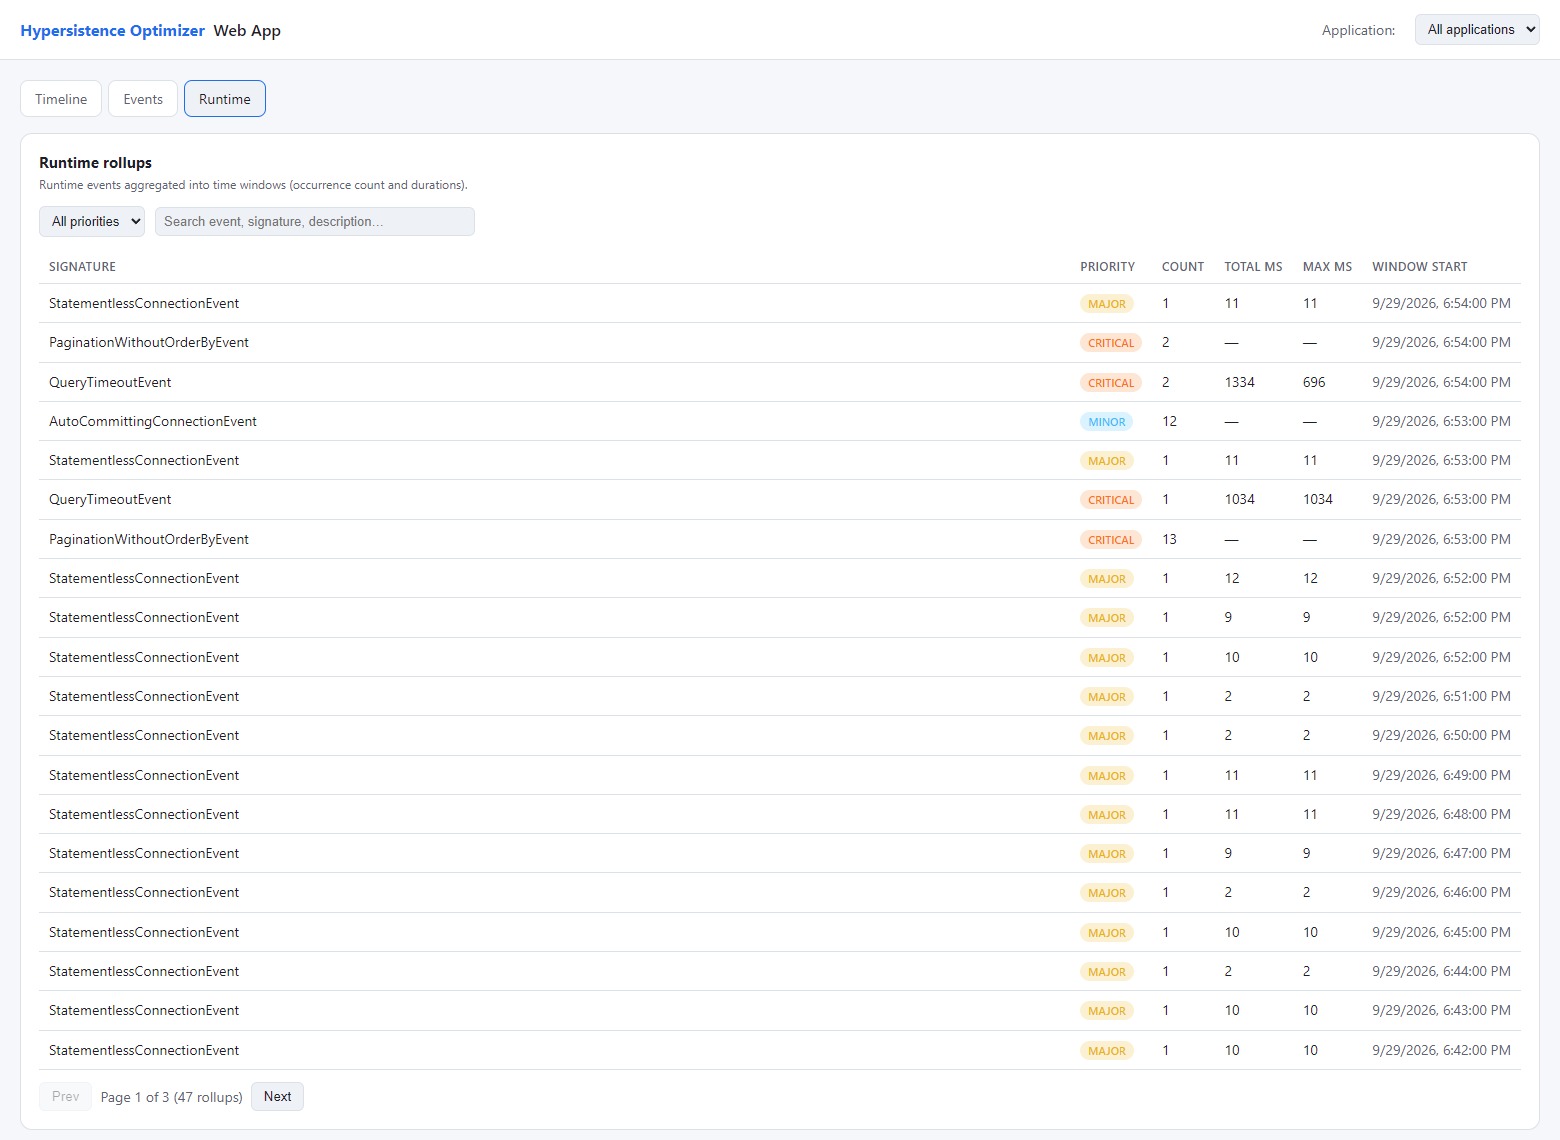
The Runtime view shows the aggregated runtime events (e.g., N+1 queries, slow queries, session or query timeouts). Each row is a rollup for a given event signature and time window, showing the occurrence count and, when the event exposes a duration, the total and maximum durations. This lets you watch a hot N+1 query or a slow query shrink after a fix is deployed. Like the Events view, the rollups are paginated, and you can filter them by priority and search for a text contained in the event name, signature, or sample description.
Security
The web app exposes only read-only endpoints and binds to localhost by default. Before making it reachable from other hosts, enable HTTP Basic authentication (--auth-user and --auth-password) and review your network exposure.
Banner
When Hypersistence Optimizer bootstraps, a banner is printed in the application log.
If you want to disable the banner printing, then you can set the bannerPrintingEnabled property of the JpaConfig or HibernateConfig objects to the value of false, like this:
new HypersistenceOptimizer(
    new JpaConfig(entityManagerFactory())
        .setBannerPrintingEnabled(false)
);
Events
Hypersistence Optimizer generates events while scanning the application metadata.
Mapping events
The mapping events are related to JPA and Hibernate mappings, and Hypersistence Optimizer can detect the following mapping issues.
Identifier mapping
HiLoOptimizerEvent
The hi/lo algorithm, while it may reduce the number of database roundtrips required to assign the sequence-based identifiers, it does not interoperate well with other systems that are unaware of the underlying hi/lo strategy being used.
For this reason, you are better off using the pooled or pooled-lo optimizer generators.
IdentityGeneratorEvent
The IdentityGeneratorEvent is triggered when an entity identifier is mapped using the IDENTITY strategy. Unlike the SEQUENCE strategy, which can delay the entity INSERT statement until the Persistence Context is flushed, the IDENTITY strategy needs to execute the INSERT statement upon calling persist. For this reason, Hibernate cannot batch inserts for entities using the IDENTITY strategy.
Therefore, if the underlying database supports sequence objects, it is much more efficient to use the SEQUENCE strategy.
For more details about this topic, check out this article.
PostInsertGeneratorEvent
The PostInsertGeneratorEvent is triggered when an entity identifier is mapped using a post-insert strategy, like the SELECT strategy, which uses a secondary SELECT statement to fetch the entity identifier generated by the database. Therefore, the only way Hibernate can get the entity identifier is if the associated row is inserted upon calling persist.
For this reason, the post-insert identifier strategies prevent Hibernate from batching inserts automatically.
For more details about this topic, check out this article.
PrimitiveIdentifierEvent
The PrimitiveIdentifierEvent instructs you that the entity identifier is mapped as a Java primitive (e.g., int, long) instead of a Java wrapper type (e.g., Integer or Long). The wrapper type allows nullable values, hence it works better with assigned entity identifiers since Hibernate knows that an entity with a null identifier does not have an associated table record.
TableGeneratorEvent
The TABLE identifier generator is very inefficient. Not only that it requires a separate database transaction as well as a separate database connection to make sure that the identifier generation process is not linked to the calling transaction, but it employs the use of row-level locks which are heavy compared to the lightweight latches used by the IDENTITY or SEQUENCE database identifier generation strategies.
The TABLE generator does not even scale well when increasing the number of threads that generate entity identifiers concurrently since it puts pressure on the underlying database connection pool, and it introduces a bottleneck at the identifier table level. You should use a SEQUENCE strategy if the database supports this feature, or use an IDENTITY column instead.
For more details about why you should avoid the TABLE generator, check out this article.
SequenceAllocationSizeEvent
This event tells you that the increment of the database sequence used by an entity identifier differs from the allocationSize of the @SequenceGenerator annotation, while the identifier generator uses the pooled or pooled-lo optimizer.
The pooled optimizers assume that every call to the database sequence allocates allocationSize identifier values. So, if the sequence increment is lower than the allocation size, the same identifier values are allocated more than once, and the inserts fail with a Primary Key constraint violation. If the sequence increment is greater than the allocation size, the identifier generator skips identifier values.
Starting with Hibernate 5.4, the mismatch is detected at bootstrap unless the hibernate.id.sequence.increment_size_mismatch_strategy configuration property is set to log or none. Hypersistence Optimizer checks it for every Hibernate version by reading the sequence increment from the database catalog. When the sequence name is not qualified by a schema, Hypersistence Optimizer uses the sequence of the current schema, or a sequence of another schema only if no other schema has a sequence with the same name and a different increment.
You should use the same value for the allocationSize attribute of the @SequenceGenerator annotation and the INCREMENT BY clause of the database sequence.
A MariaDB sequence with an increment of 0 uses the auto_increment_increment value (e.g., on a Galera cluster), so this value is compared with the allocation size instead.
MissingPrimaryKeyEvent
This event tells you that the table mapped by an entity has no Primary Key in the database. The entities mapped to database views are not checked, since a view cannot have a Primary Key.
Without a Primary Key, the database cannot enforce the uniqueness of the entity identifier, and the identifier lookups might need to scan the table. On MySQL and MariaDB, InnoDB uses a hidden clustered index instead, and the row-based replication needs to scan the table for every record change.
You should add a Primary Key on the entity identifier column(s).
SequenceCacheSizeEvent
This event tells you that the Oracle, SQL Server, or MariaDB sequence used by an entity identifier caches fewer than 20 values (e.g., it was created with NOCACHE), so the database needs to update the sequence in the data dictionary more often, which slows down the inserts and can cause contention.
The event is not triggered when the identifier optimizer fetches 20 values or more at once (e.g., the default allocationSize of 50), since a sequence call is then needed only once every allocationSize inserts. You should use a sequence cache of at least 20 values (e.g., ALTER SEQUENCE post_seq CACHE 20). The MariaDB sequences cache 1000 values by default, and their cache size is read from the sequence itself, since the information_schema views don’t provide it. The minimum sequence cache size of 20 values can be changed via the hypersistence.sequence.min_cache_size property, as explained in the Thresholds section.
RandomUuidPrimaryKeyEvent
This event tells you that an entity identifier is generated as a random (version 4) UUID (e.g., by the Hibernate uuid2 generator, or the default @UuidGenerator style), while the table is clustered by its Primary Key, as it’s the case for the MySQL and MariaDB InnoDB tables and, by default, for the SQL Server tables.
Since every new record is inserted at a random position in the clustered index, the inserts cause page splits, so the clustered index gets fragmented, and its pages are only partially filled. You should use a time-ordered UUID (e.g., version 7) or a sequence-based identifier.
Basic mapping
DefaultLazyGroupEvent
When using the bytecode enhancement lazy loading mechanism, the lazy entity attributes that are not annotated with @LazyGroup belong to the same default lazy group. When accessing any of these lazy attributes, Hibernate fetches all the lazy attributes from the default lazy group, even if you need only one of them.
For instance, if an entity has a lazy content attribute and a lazy summary attribute, accessing the summary attribute will also fetch the content attribute, which might be a large column.
For this reason, if the lazy attributes are not used together, you should annotate them with @LazyGroup so that each lazy group is fetched individually:
@Basic(fetch = FetchType.LAZY)
@LazyGroup("content")
private String content;

@Basic(fetch = FetchType.LAZY)
@LazyGroup("summary")
private String summary;
If the lazy attributes are always used together, you can give them the same explicit @LazyGroup name or use an EventFilter to ignore this event.
For more details about this topic, check out this article.
EnumTypeStringEvent
The Java Enum can be mapped in two ways with JPA and Hibernate. By default, the Enum ordinal is used to materialize the Enum value in the database. However, to make it more readable, some developers choose to store the Enum name instead, which has a higher memory and disk footprint.
For more details about this topic, check out this article.
LargeColumnEvent
Table columns should be as compact as possible. For this reason, you should always strive for using the most compact types which can accommodate all possible values stored in a given column.
Unless you can choose more compact types, you might consider moving the large columns to a separate table. You could use a one-to-one table relationship to store the large columns, especially if they are not used frequently. Also, you could use multiple entities mapped to the same database table so that you can choose which properties are to be loaded from the database based on the entity type that you are currently fetching.
In case you have annotated the large column with @Basic(fetch=LAZY), you need to also activate the bytecode enhancement lazy loading mechanism as, otherwise, the column is going to be fetched eagerly when the entity is loaded. If the entity has multiple lazy attributes, check out the DefaultLazyGroupEvent as well.
If you cannot enable the bytecode enhancement lazy loading mechanism, you should at least use the @DynamicUpdate annotation on the entity level so that the UPDATE statement contains only the columns that have been modified by the currently running Persistence Context. This will reduce the impact of large columns on the underlying transaction log. Otherwise, not only that the transaction log gets bigger, but this can also affect replication since the log entries are propagated to follower nodes.
SqlServerNationalizedEntityAttributeEvent
This event tells you that a String entity attribute is mapped to an NCHAR, NVARCHAR, or NTEXT column without being nationalized, while your application has disabled the sendStringParametersAsUnicode SQL Server JDBC Driver setting.
When the sendStringParametersAsUnicode setting is disabled, the SQL Server JDBC Driver sends the String bind parameter values as VARCHAR, so the characters that are not supported by the code page of the database collation are lost when writing these Unicode columns.
Hypersistence Optimizer triggers this event for every entity attribute that needs to be changed, and, to fix it, you should annotate the entity attribute with the Hibernate @Nationalized annotation, so that Hibernate binds it as NVARCHAR:
@Nationalized
private String title;
If all your String entity attributes are mapped to Unicode columns, you can also set the hibernate.use_nationalized_character_data configuration property to the value of true.
OracleDateColumnTimestampBindingEvent
This event tells you that an entity attribute bound as a TIMESTAMP, like a LocalDateTime or a java.util.Date annotated with @Temporal(TemporalType.TIMESTAMP), is mapped to an Oracle DATE column.
Since the bind parameter type is TIMESTAMP, Oracle converts the DATE column values to TIMESTAMP using the INTERNAL_FUNCTION when filtering by this column, so the column index cannot be used.
You should either change the column type to TIMESTAMP or map the attribute so that it’s bound as a DATE.
For more details about this topic, check out this article.
SqlServerDatetimeColumnEvent
This event tells you that an entity attribute bound as a TIMESTAMP is mapped to an SQL Server DATETIME or SMALLDATETIME column, while the database compatibility level is 130 (SQL Server 2016) or newer.
The SQL Server JDBC Driver sends the timestamp bind parameter values as DATETIME2, and, starting with the 130 compatibility level, SQL Server converts the DATETIME column values to DATETIME2 with a higher precision. For instance, the 2016-01-01 00:00:00.003 value is stored as 2016-01-01 00:00:00.0033333, so an equality predicate using the same timestamp value doesn’t match the record.
You should change the column type to DATETIME2 or, if you are using the 12.2 SQL Server JDBC Driver or newer, set the datetimeParameterType JDBC Driver configuration property to the value of datetime. With an older SQL Server JDBC Driver, the event description tells you to upgrade the JDBC Driver first, since the datetimeParameterType property is not available.
UuidTextColumnEvent
This event tells you that a java.util.UUID entity attribute or identifier is mapped to a text column (e.g., CHAR(36) or VARCHAR(36)), which takes 36 bytes, or more, instead of 16, so the table and its indexes are larger, and the comparisons are slower.
You should use the native UUID column type (e.g., uuid on PostgreSQL and on MariaDB 10.7 or later, uniqueidentifier on SQL Server) or a binary one (e.g., BINARY(16) on MySQL, RAW(16) on Oracle).
OracleLongColumnEvent
This event tells you that an entity attribute is mapped to an Oracle LONG or LONG RAW column. These column types are deprecated, a table can have only one such column, and they cannot be used by most SQL functions or in the WHERE clause.
You should use the CLOB column type instead of LONG, and the BLOB column type instead of LONG RAW.
OracleBasicFileLobEvent
This event tells you that an entity attribute is mapped to an Oracle LOB column stored as a BasicFile LOB. The SecureFile LOBs, which are the default since Oracle 12c, are faster, and they support compression, deduplication, and encryption.
You should convert the column to a SecureFile LOB (e.g., ALTER TABLE post MOVE LOB(content) STORE AS SECUREFILE).
Version mapping
IntegerVersionColumnSizeEvent
The version property used for optimistic locking should be as compact as possible since its goal is to make sure that the underlying table row version matches the current entity version property. Since an integer column type takes 4 bytes, this could be a waste of space if the entity is not changed frequently.
A version property mapped to a smallint is sufficient for the vast majority of use cases since it allows the version to change 65000 times in between the read and the write of a given database table record.
For more details about this topic, check out this article.
LongVersionColumnSizeEvent
The version property used for optimistic locking should be as compact as possible since its goal is to make sure that the underlying table row version matches the current entity version property. Since a long or bigint column takes 8 bytes, this could be a waste of space if the entity is not changed frequently.
A version property mapped to a smallint is sufficient for the vast majority of use cases since it allows the version to change 65000 times in between the read and the write of a given database table record.
For more details about this topic, check out this article.
TimestampVersionEvent
When implementing a Concurrency Control algorithm, it is not a good idea to rely on physical or walk clock time because it is not reliable. Due to the NTP protocol, the clock time can jump backward, hence compromising the monotonic time reading property required by a concurrency control mechanism.
Therefore, you should favor using logical clocks instead, like the optimistic locking numerical-based version property.
For more details about this topic, check out this article.
Equality mapping
EqualsHashCodeEvent
The JPA entity could be stored in a Java Collection, like ArrayList or HashSet, or
as a key or value in a Java Map. For this reason, it’s very important to implement the Java equals and hashCode methods according to the Java equality contract, which defines the equivalence relation properties:
- Reflexivity
- Symmetry
- Transitivity
- Consistency
While the first three are quite easy to address, Consistency is trickier because, in the context of JPA, you need to make sure that multiple invocations of equals and hashCode yield the same result no matter the JPA entity state change (New, Managed, Detached, Removed).
For more details about this topic, check out this article.
Relationship mapping
BidirectionalSynchronizationEvent
When mapping a bidirectional one-to-many or many-to-many associations, you need to synchronize both sides of the association. Without synchronizing both sides, Hibernate cannot guarantee that the association state changes propagate to the database.
More, unsynchronized bidirectional associations can also lead to very subtle bugs that are hard to reproduce. For this reason, it’s best to have two utility methods (e.g., addEntity and removeEntity) on the mappedBy side of the one-to-many or many-to-many associations.
You should avoid the
enableAssociationManagementBytecode Enhancement option. Even if it aims to synchronize automatically both ends of a bidirectional association, this behavior works only from the parent-side to the child-side.The
enableAssociationManagementoption does not synchronize the@OneToManyside when the@ManyToOneassociation state changes.
For more details about this topic, check out this article.
ElementCollectionArrayEvent
The JPA element-collection mapped as a Java array is treated like a bag, meaning that elements are removed and reinserted back whenever the array is changed. For this reason, you are better off using a java.util.Set, which generates much more efficient SQL statements.
For more details about this topic, check out this article.
ElementCollectionEvent
The JPA element-collection requires all child operations to be executed from the parent side, hence, if you want to add or remove a child element, you always need to fetch the collection. For this reason, you should consider using a bidirectional one-to-many association instead or just use a @ManyToOne association and replace the collection with a query.
For more details about this topic, check out this article.
ElementCollectionListEvent
The JPA element-collection mapped as a java.util.List is treated like a bag, meaning that elements are removed and reinserted back whenever an element is removed from the List. For this reason, you are better off using a java.util.Set, which generates much more efficient SQL statements.
For more details about this topic, check out this article.
ManyToManyCascadeRemoveEvent
When mapping a many-to-many association, the CascadeType.REMOVE, which can also be inherited from CascadeType.ALL will propagate the remove entity state transition to the other entity, which is a parent, not a child entity.
Therefore, for many-to-many associations, we are only interested in removing the associated link table records, which is done automatically when dereferencing a child from the many-to-many collection.
For more details about this topic, check out this article.
ManyToManyListEvent
When mapping a many-to-many association, you should use a Java Set, not a List because the List is treated like a bag in Hibernate terminology, and a bag may generate inefficient SQL statements.
For more details about this topic, check out this article.
NullCollectionEvent
To avoid unnecessary null checks or, even worse, getting a NullPointerException, it’s better if all collections are initialized when the parent entity object is instantiated.
Hibernate uses collection proxies to enable the runtime lazy loading mechanism, so a collection is not null even prior to fetching the lazy collection.
OneToOneParentSideEvent
When mapping a one-to-one relationship, you can choose either a unidirectional or a bidirectional association. The unidirectional association will map the parent entity on the child side only while the bidirectional association will also map the child entity reference in the parent entity.
When the parent-side association is optional, at load time, Hibernate has no idea whether to assign null or a Proxy for the child entity reference on the parent side. Therefore, a secondary query will be executed when fetching the parent entity without join fetching the child entity association. This can lead to N+1 query issues, which can, in turn, hurt application performance.
To fix this issue, you should either use a unidirectional one-to-one association or set the optional attribute to the value of false. If the parent-side association has to be optional, then you can use bytecode enhancement to load this entity attribute lazily.
For more details about this topic, check out this article.
OneToOneWithoutMapsIdEvent
The one-to-one table relationship should be mapped so that the child table Primary Key is also a Foreign Key to the parent table Primary Key. This means that the parent and the child table records share their Primary Key values.
Without using @MapsId, the one-to-one association looks more like a one-to-many table relationship where the separate Foreign Key column has a unique key constraint. For this reason, you should always favor using @MapsId when mapping a one-to-one relationship.
The one-to-one associations that reference the same entity or its entity hierarchy (e.g., a Movement referencing its parent Movement) are not reported, since a record cannot share its Primary Key with another record of the same table or entity hierarchy, so the separate Foreign Key column is the only option.
For more details about this topic, check out this article.
SqlServerForeignKeyLockingEvent
By default, Hibernate includes all the non-identifier entity columns in the SET clause of an UPDATE statement, and, for this reason, on SQL Server, a shared lock is acquired on the parent table record to ensure that the Foreign Key is not going to reference a non-existing parent row.
To reduce the likelihood of locking and deadlocks, you are better off setting @DynamicUpdate on the entities containing @ManyToOne or non-shared @OneToOne association.
For more details about this topic, check out this article.
UnindexedForeignKeyEvent
This event tells you that the Foreign Key columns of an entity association are not the leading columns of any index of the table they belong to. Hypersistence Optimizer checks the @ManyToOne and the owning @OneToOne associations, the unidirectional @OneToMany associations, the @ManyToMany join tables, and the @ElementCollection tables.
Unlike MySQL, PostgreSQL, Oracle, and SQL Server don’t create an index for the Foreign Key columns automatically, and Hibernate doesn’t create one either when generating the schema. Without such an index, joining the tables or fetching the child records needs to scan the child table, and so does deleting a parent record, which needs to check the Foreign Key constraint. On Oracle, deleting a parent record also locks the entire child table.
You should create an index on the Foreign Key column(s). A composite index works too, as long as it starts with the Foreign Key column(s). The entities mapped to database views are not checked, since a view cannot have indexes.
For more details about this topic, check out this article.
MySQLJoinColumnCollationEvent
This event tells you that the MySQL or MariaDB Foreign Key column of a @ManyToOne or @OneToOne association uses a different character set or collation than the Primary Key column it references (e.g., latin1_swedish_ci and utf8mb4_0900_ai_ci).
When joining these tables, the database needs to convert the values of one side, so the index of the converted column cannot be used. MySQL and MariaDB don’t allow such a Foreign Key constraint, so this usually happens for the associations without a Foreign Key constraint, or for the tables created by different scripts. You should use the same character set and collation for both columns.
UnidirectionalOneToManyEvent
The unidirectional one-to-many association uses a link table and an additional Foreign Key column, which is not very efficient from a mapping perspective. Even worse, the generated SQL statements are not very efficient either, especially when using a Java List. You should consider using a bidirectional one-to-many association instead.
For more details about this topic, check out this article.
UnidirectionalOneToManyJoinTableEvent
The unidirectional one-to-many association that uses an explicit join column does not render very efficient SQL statements since the child entity insert is executed first while the collection is processed later at the Persistence Context flush time. For this reason, instead of a single INSERT, you’d see an INSERT and an UPDATE statement being executed. You should consider using a bidirectional one-to-many association instead.
For more details about this topic, check out this article.
Table mapping
The following events are triggered by the properties of the tables mapped by the entities, which Hypersistence Optimizer reads from the database catalog, unless the database scanner is disabled.
SqlServerHeapTableEvent
This event tells you that the SQL Server table mapped by an entity has no clustered index, so the table is stored as a heap.
The heap records that don’t fit their page after an update are moved, leaving a forwarding pointer behind, every nonclustered index access needs a RID lookup, and the space freed by the deletes is not always reused. You should add a clustered index, which is usually the Primary Key.
RedundantIndexEvent
This event tells you that a non-unique index of a table mapped by an entity is redundant, since its columns are the leading columns of another index of the same table (e.g., an index on (title) and another one on (title, id)), which can serve the same queries.
Every index needs to be updated by the inserts, the updates, and the deletes, and it takes space in the buffer pool. You should drop the redundant index. The unique indexes are not reported, since they also enforce a constraint.
PostgreSQLInvalidIndexEvent
This event tells you that an index of a PostgreSQL table mapped by an entity is invalid, which usually happens when a CREATE INDEX CONCURRENTLY statement fails (e.g., because the table contains duplicate values for a unique index).
An invalid index is updated by every insert, update, and delete, but the queries never use it, and an invalid unique index still rejects the duplicate values. You should either rebuild the index (e.g., REINDEX INDEX CONCURRENTLY idx_post_title) or drop it and create it again.
StaleTableStatisticsEvent
This event tells you that the optimizer statistics of a table mapped by an entity are stale (Oracle ALL_TAB_STATISTICS.STALE_STATS is YES) or were never gathered although the table has records (PostgreSQL pg_stat_user_tables has neither a last_analyze nor a last_autoanalyze value), so the query optimizer might misestimate the number of rows and choose a bad execution plan.
You should gather the table statistics (e.g., ANALYZE post on PostgreSQL or DBMS_STATS.GATHER_TABLE_STATS on Oracle), and check why the automatic statistics collection didn’t do it.
Fetch strategy mapping
BatchFetchingEvent
Using batch fetching to initialize an association to avoid the N+1 query issue is not very efficient and might indicate that the underlying collection is too large to be mapped as an entity association and that it should be replaced with an entity query instead.
EagerFetchingEvent
Using the FetchType.EAGER strategy, or mapping an entity association using @LazyToOne(LazyToOneOption.FALSE) or @Fetch(FetchMode.JOIN) is a very bad idea because, at mapping time, you have no indication of what might be needed when fetching an entity.
Eager fetching can also lead to N+1 query issues if the FetchType.EAGER association is not fetched explicitly in every JPQL or Criteria API query that fetches the parent entity.
For this reason, you should prefer using FetchType.LAZY instead, and override the lazy loading strategy at query time if that’s needed by the current business use case.
For more details about this topic, check out this article.
ExtraLazyCollectionEvent
The use of the LazyCollectionOption.EXTRA strategy indicates that the underlying collection is too large to be mapped as an entity association and that it should be replaced with an entity query instead.
For more details about this topic, check out this article.
SubSelectFetchingEvent
Using subselect fetching to initialize an association so to avoid the N+1 query issue might indicate that the underlying collection is too large to be mapped as an entity association and that it should be replaced with an entity query instead.
Also, you should consider using DTO projections, which can also be fetched as graphs, if you don’t plan to modify the entities being fetched.
Cache mapping
NaturalIdCacheEvent
The natural id mapping allows you to fetch an entity by its associated business key. However, this is a two-stage process. First, the entity identifier is resolved by its associated natural id. Second, with the entity identifier resolved, the entity is fetched from the Persistence Context.
To save the first query, you can use the NaturalIdCache entity mapping.
For more details about this topic, check out this article.
Inheritance mapping
StringDiscriminatorTypeEvent
The entity identifier discriminator column can be mapped as a numeric value, a char, or a String. The String strategy, although more readable, is the least compact strategy. For this reason, you should favor the numeric-based strategy, which can also be designed to be readable via a separate description table.
For more details about this topic, check out this article.
TablePerClassInheritanceEvent
The TABLE_PER_CLASS inheritance strategy is not very efficient, especially for polymorphic queries. You should use either SINGLE_TABLE or JOINED instead if you need to materialize the entity inheritance tree in the database. Otherwise, use @MappedSuperclass if the entity inheritance is only needed on the domain model side.
Configuration events
The configuration events are related to Hibernate, and Hypersistence Optimizer can detect the following configuration issues.
Audit configuration
DefaultHibernateAuditStrategyEvent
Since Hibernate 7.4, you can audit the entities annotated with the Hibernate @Audited annotation without using Hibernate Envers.
This event tells you that your application has @Audited entities and uses the default audit strategy, which finds the audit row of every point-in-time query using a MAX(REV) subquery. The validity audit strategy stores the changeset that superseded each audit row in the REVEND column, so point-in-time queries can use a range predicate instead, which is much more efficient for large audit tables.
You should set the hibernate.audit.strategy configuration property to the value of validity. However, switching the audit strategy requires changing the audit tables, so take this into consideration prior to changing the strategy. This is the same advice the DefaultAuditStrategyEvent gives for Hibernate Envers.
Batching configuration
JdbcBatchToBulkInsertEvent
Some databases, like PostgreSQL and MySQL, allow batch inserts to be executed as bulk multi-value INSERT statements.
This way, not only are network roundtrips saved, but the database engine has fewer statements to execute as well.
When using PostgreSQL, you can set the reWriteBatchedInserts property to the value of true to rewrite the JDBC batch insert as a bulk INSERT statement.
For more details about the PostgreSQL reWriteBatchedInserts JDBC Driver configuration property, check out this article.
When using MySQL, you can set the rewriteBatchedStatements property to the value of true, and the JDBC Driver will replace a JDBC batch insert with a bulk multi-value INSERT statement.
Check out this article for more details about the MySQL rewriteBatchedStatements JDBC Driver configuration property.
When using MariaDB Connector/J 3 with MariaDB, the JDBC Driver sends the batched INSERT statements using the bulk protocol, which executes the batch in a single database round trip, unless both the useBulkStmtsForInserts property, which is available and true by default since the 3.2 version, and the useBulkStmts property are set to false. You should enable the useBulkStmtsForInserts property rather than the useBulkStmts one, which also sends the batched UPDATE and DELETE statements using the bulk protocol, as explained by the MariaDBUseBulkStmtsEvent.
MariaDB Connector/J 3 doesn’t support the rewriteBatchedStatements property anymore, and MySQL doesn’t support the bulk protocol, so, when MariaDB Connector/J connects to MySQL, the batched statements are executed one by one, and this event is always triggered. In this case, you should use MySQL Connector/J with the rewriteBatchedStatements property set to true.
When using SQL Server with the 9.2 JDBC Driver or newer, you can set the useBulkCopyForBatchInsert property to the value of true, and the JDBC Driver will use the Bulk Copy API to execute the JDBC batch insert statements. Since this property affects only the JDBC batch inserts, this event is triggered on SQL Server only if JDBC batching is enabled (e.g., via the hibernate.jdbc.batch_size configuration property).
However, by default, the Bulk Copy API doesn’t check the CHECK constraints, doesn’t fire the insert triggers, and replaces the explicit NULL values with the column default values. For this reason, on SQL Server, this event has the MINOR priority, and you should enable this feature only if your application doesn’t rely on these features or, starting with the 12.10 JDBC Driver version, if you configure the bulkCopyForBatchInsertCheckConstraints, bulkCopyForBatchInsertFireTriggers, and bulkCopyForBatchInsertKeepNulls properties accordingly.
For more details about the SQL Server useBulkCopyForBatchInsert JDBC Driver configuration property, check out the SQL Server JDBC Driver documentation.
JdbcBatchOrderInsertsEvent
The hibernate.order_inserts configuration property should be enabled so that Hibernate can reorder SQL insert statements upon flushing the Persistence Context.
This is especially useful when cascading entity state transitions since, without reordering, the batch must be flushed when switching from one entity to another.
For more details about the hibernate.order_inserts configuration property, check out this article.
JdbcBatchOrderUpdatesEvent
The hibernate.order_updates configuration property should be enabled so that Hibernate can reorder SQL update statements upon flushing the Persistence Context.
This is especially useful when cascading entity state transitions since, without reordering, the batch must be flushed when switching from one entity to another.
For more details about the hibernate.order_updates configuration property, check out this article.
JdbcBatchSizeEvent
The hibernate.jdbc.batch_size configuration property should be set to an integer value greater than 1 (usually between 5 and 30) so that Hibernate can execute SQL statements in batches, therefore reducing the number of database network roundtrips.
For more details about the hibernate.jdbc.batch_size configuration property, check out this article.
JdbcBatchVersionedEntitiesEvent
You should consider enabling the hibernate.jdbc.batch_versioned_data configuration property so that Hibernate can batch updates and deletes for entities that have a @Version property. Otherwise, JDBC batch updates and deletes are disabled for the versioned entities.
This property was disabled prior to Hibernate 5, so make sure you enable it for Hibernate 3 and 4. If you’re using Oracle, you might want to upgrade the JDBC Driver from 10g to a newer version as well as upgrading the Hibernate Oracle Dialect to at least Oracle12cDialect to be able to batch update and delete statements for versioned entities.
For more details about the hibernate.jdbc.batch_versioned_data configuration property, check out this article.
Connection configuration
ConnectionReleaseAfterStatementEvent
When using JTA, Hibernate releases the associated database connection after every executing statement. As explained in this article, this strategy can incur a response time overhead. For this reason, if you are using a stand-alone JTA transaction manager (e.g., Bitronix, Atomikos) or a Java EE application server that does not require this aggressive connection release mode, then you should switch to releasing the connection when the transaction is ended.
Since Hibernate 5.2, you can set the connection acquisition and release strategy via the hibernate.connection.handling_mode configuration property. So, if you’re using JTA, you might want to provide the following configuration property, which instructs Hibernate to release the database connection only after the JPA transaction is ended.
<property
    name="hibernate.connection.handling_mode"
    value="delayed_acquisition_and_release_after_transaction"
/>
For Hibernate versions that are older than 5.2, you should use the hibernate.connection.release_mode configuration property instead. So, if you’re using JTA, you might want to provide the following configuration property, which instructs Hibernate to release the database connection only after the JPA transaction is ended.
<property
    name="hibernate.connection.release_mode"
    value="after_transaction"
/>
DriverManagerConnectionProviderEvent
The DriverManagerConnectionProvider is not suitable to be used in a production environment. Although it features a rudimentary connection pooling solution, you should consider using a professional pooling framework, like HikariCP.
DataSourceConnectionProviderEvent
The DataSourceConnectionProvider is the most flexible ConnectionProvider implementation as it allows you to chain as many DataSource proxies as you need, like connection pooling, logging, and monitoring.
Without using the DataSourceConnectionProvider, it’s hard to configure a tool like datasource-proxy which, not only that it gives you advanced logging capabilities, but you can use it to automatically detect N+1 query issues.
More, when using the DataSourceConnectionProvider, you can easily integrate FlexyPool, which allows you to monitor the database connection usage and determine the right connection pool size.
SkipAutoCommitCheckEvent
As I explained in this article, when using RESOURCE_LOCAL transactions, which is the default for Spring and Spring Boot applications, the database connection is acquired eagerly at the beginning of the JPA transaction (when entering the @Transactional service method) because the auto-commit flag has to be checked and disabled accordingly.
If you already configured the underlying connection pool to disable the auto-commit flag when acquiring a JDBC Connection, then you should instruct Hibernate to skip the auto-commit check via the following configuration property:
<property
    name="hibernate.connection.provider_disables_autocommit"
    value="true"
/>
If Hypersistence Optimizer can read the connection pool settings, as explained in the Connection pool configuration section, the event also tells you whether the pool already disables the auto-commit mode (e.g., the HikariCP autoCommit is false), so you only need to set this property, or whether you need to disable the auto-commit mode in the pool as well.
ConnectionPoolAutoCommitEvent
This event tells you that the hibernate.connection.provider_disables_autocommit configuration property is set to true, but the connection pool hands out the connections in auto-commit mode (e.g., the HikariCP autoCommit or the DBCP2 defaultAutoCommit is true).
In this case, Hibernate no longer disables the auto-commit mode when a transaction starts, so every statement is committed on its own, the transaction is no longer atomic, and the transaction commit fails because the connection is in auto-commit mode. You should disable the auto-commit mode in the connection pool settings.
Connection pool configuration
Hypersistence Optimizer reads the settings of the connection pool used by Hibernate, no matter if Hibernate gets the pool as a DataSource (e.g., in Spring Boot or Quarkus) or creates it via a ConnectionProvider (e.g., the Hibernate C3P0ConnectionProvider). The following connection pools are supported:
| Connection pool | Maximum connection lifetime | Maximum pool size | Auto-commit mode |
|---|---|---|---|
| HikariCP | maxLifetime |
maximumPoolSize |
autoCommit |
| Apache Commons DBCP2 | maxConnLifetimeMillis |
maxTotal |
defaultAutoCommit |
| Agroal | maxLifetime |
maxSize |
autoCommit |
| c3p0 | maxConnectionAge |
maxPoolSize |
none |
| Oracle UCP | maxConnectionReuseTime |
maxPoolSize |
none |
| Tomcat JDBC | maxAge |
maxActive |
defaultAutoCommit |
The connection pool settings are read even if the database scanner is disabled, but the checks that compare them with the database server settings (e.g., the MySQLWaitTimeoutEvent, the PostgreSQLIdleSessionTimeoutEvent, or the ConnectionPoolMaxConnectionsEvent) need the database scanner.
ConnectionPoolMaxLifetimeEvent
This event tells you that the maximum connection lifetime of the connection pool is unlimited, so the pooled connections are never replaced.
Firewalls, NAT gateways, and load balancers silently drop the TCP connections that stay idle for longer than their timeout (e.g., 350 seconds for the AWS Network Load Balancer), so the pool can hand out connections that are no longer usable, unless it checks its idle connections often enough to keep them alive. Also, the connections are not moved to a new database node after a failover or a DNS change, and the database server memory used by long-lived sessions keeps growing.
You should set the maximum connection lifetime (e.g., 30 minutes) a few seconds lower than any connection time limit imposed by the database or the network infrastructure.
This event is not triggered when the database server closes the idle connections before the pool does, since the MySQLWaitTimeoutEvent and the PostgreSQLIdleSessionTimeoutEvent already report it.
ConnectionPoolSizeEvent
This event tells you that the connection pool can open more than 30 connections (e.g., the Tomcat JDBC maxActive defaults to 100, and the Oracle UCP maxPoolSize is unlimited by default).
The database throughput doesn’t grow with the number of connections. Once the active connections exceed the number of database server CPU cores, they compete for the CPU, the disk, and the locks, and every connection uses database server memory, so a large pool increases the response time instead of the throughput. A pool of up to 30 connections is usually enough, even for a busy application. You should lower the maximum pool size, and measure the pool usage (e.g., with FlexyPool) to find the right size for your application.
This event is not triggered when the pool is too large for the database server max_connections setting, since the ConnectionPoolMaxConnectionsEvent already reports it. The maximum recommended pool size of 30 connections can be changed via the hypersistence.connection_pool.max_size property, as explained in the Thresholds section.
ConnectionPoolValidationQueryEvent
This event tells you that the connection pool validates the connections with a query (e.g., the HikariCP connectionTestQuery, the DBCP2 or Tomcat JDBC validationQuery, the c3p0 preferredTestQuery, or the Oracle UCP sqlForValidateConnection), although the JDBC Driver supports the JDBC 4 Connection#isValid method, which checks the connection with a lighter call (e.g., a protocol-level ping on MySQL and Oracle).
You should remove the validation query setting, so that the pool uses the Connection#isValid method instead. The event is not triggered for the jTDS JDBC Driver, which doesn’t implement the Connection#isValid method.
Database server configuration
The following events are triggered by the database server settings, which Hypersistence Optimizer reads when it’s bootstrapped, unless the database scanner is disabled, as explained in the Enabling or disabling scanners section.
MariaDB shares the InnoDB storage engine and most of the server settings with MySQL, so the MySQL server events are also triggered for MariaDB, with the differences explained by every event. MariaDB is recognized even if the JDBC Driver reports it as MySQL, as MySQL Connector/J does, by its version (e.g., 11.8.3-MariaDB).
PostgreSQLJitEvent
This event tells you that the PostgreSQL jit setting is on while the jit_above_cost setting uses its default value of 100000. If the PostgreSQL server was built without LLVM, the JIT compilation never runs, so this event is not triggered (e.g., when the pg_jit_available() function returns false).
For OLTP queries that run in milliseconds, the JIT compilation can take longer than the query execution itself, and the planner cost estimates cannot predict when that happens. You should set the jit setting to off (e.g., ALTER DATABASE ... SET jit = off), or at least increase the jit_above_cost value.
PostgreSQLIdleInTransactionSessionTimeoutEvent
This event tells you that the PostgreSQL idle_in_transaction_session_timeout setting is 0, which is the default value, so the sessions left idle in an open transaction are never terminated.
This can happen because of a connection leak or because the application executes a long-running operation, like a remote call, inside a database transaction. Such sessions keep their locks, blocking other transactions, and prevent VACUUM from removing the dead tuples, which leads to table and index bloat.
You should set the idle_in_transaction_session_timeout setting for the application database user (e.g., ALTER ROLE ... SET idle_in_transaction_session_timeout = '1min').
The pooled connections are not affected by this timeout while they wait in the pool since they are returned after the transaction is committed or rolled back, so their session state is idle, not idle in transaction. However, when the timeout expires, PostgreSQL terminates the entire session, not just the transaction, so the application gets an error on the next statement, and the connection pool needs to replace the broken connection. For this reason, the timeout value should be greater than the longest pause your application can legitimately make inside a database transaction.
PostgreSQLIdleSessionTimeoutEvent
This event tells you that the PostgreSQL idle_session_timeout setting, available since PostgreSQL 14, closes the idle connections before the connection pool retires them, because the pool maximum connection lifetime is not lower than the idle_session_timeout, and the pool doesn’t validate or close its idle connections before the timeout expires either.
This is the PostgreSQL equivalent of the MySQLWaitTimeoutEvent, and it supports the same connection pools. Unlike the idle_session_timeout, the idle_in_transaction_session_timeout and the statement_timeout settings don’t affect the connections that wait in the pool, since such connections have no open transaction or running statement.
You should set the maximum connection lifetime a few seconds lower than the idle_session_timeout, or make the pool check its idle connections more often than the idle_session_timeout.
PostgreSQLAutovacuumEvent
This event tells you that the PostgreSQL autovacuum setting is off, so the dead tuples are not removed automatically, and the table statistics are not updated. This leads to table and index bloat, bad execution plans, and, eventually, to a database shutdown to prevent the transaction ID wraparound. You should set the autovacuum setting to on.
PostgreSQLSharedBuffersEvent
This event tells you that the PostgreSQL shared_buffers setting uses the default value of 128 MB, which is too small to cache the working set of most applications, so the queries need to read the data pages from the OS cache or from disk.
You should size the shared buffers according to the database server memory, a common starting point being 25% of the memory of a dedicated database server. Changing the shared_buffers setting requires a database server restart.
PostgreSQLEffectiveCacheSizeEvent
This event tells you that the PostgreSQL effective_cache_size setting uses the default value of 4 GB.
This setting doesn’t allocate any memory, but it tells the query planner how much memory is available for caching the data pages, both in the shared buffers and in the OS cache. If the database server has more memory, the planner overestimates the cost of the index scans and might choose a sequential scan instead. You should set the effective_cache_size setting to the memory available for caching, a common starting point being 50% to 75% of the memory of a dedicated database server.
PostgreSQLStatementTimeoutEvent
This event tells you that the PostgreSQL statement_timeout setting is 0 and, since PostgreSQL 17, that the transaction_timeout setting is 0 too, so a runaway query (e.g., because of a missing index or a bad execution plan) can run forever, holding a database connection and its locks.
You should set these timeouts for the application database user (e.g., ALTER ROLE ... SET statement_timeout = '30s') or via the options JDBC Driver property (e.g., options=-c statement_timeout=30s), rather than globally, since the maintenance jobs might run longer transactions.
A server-side timeout doesn’t replace the client-side network timeout reported by the JdbcSocketTimeoutEvent, since the database server cannot notify the client over a dead TCP connection.
PostgreSQLQueryStatisticsEvent
This event tells you that the PostgreSQL pg_stat_statements extension is not installed in the current database, or that the track_io_timing setting is off, so you cannot find the queries that consume the most execution time or wait the longest for the disk reads.
You should add pg_stat_statements to the shared_preload_libraries setting, execute the CREATE EXTENSION pg_stat_statements statement, and set the track_io_timing setting to on, whose overhead is low on most platforms, as the pg_test_timing tool can tell.
PostgreSQLSlowQueryLogEvent
This event tells you that the PostgreSQL log_min_duration_statement setting is -1, so the slow queries are not logged. You should set it to a threshold (e.g., 1s), so that the queries running longer than that are logged.
PostgreSQLAutoExplainEvent
This event tells you that the PostgreSQL auto_explain module doesn’t log the actual execution plans of the slow queries, because the module is not loaded, the auto_explain.log_min_duration setting is -1, or the auto_explain.log_analyze setting is off.
Running EXPLAIN ANALYZE afterward might not be allowed in production, and it might show a different plan than the one used by the slow query (e.g., a generic plan used by a prepared statement, or a plan based on outdated statistics). With auto_explain, PostgreSQL logs the plan it actually used, along with the actual row counts and timings.
You should enable it as follows:
session_preload_libraries = 'auto_explain'
auto_explain.log_min_duration = '100ms'
auto_explain.log_analyze = on
Since auto_explain.log_analyze measures the execution of every statement, you can set auto_explain.log_timing to off if the timing overhead is too high on your platform.
PostgreSQLRandomPageCostEvent
This event tells you that the PostgreSQL random_page_cost setting uses the default value of 4, which assumes that reading a random page is 4 times more expensive than reading the next sequential page, as it was the case for spinning disks.
On SSD or cloud storage, the random reads are almost as fast as the sequential ones, so the query planner might choose a sequential scan instead of an index scan. If the database runs on SSD or cloud storage, you should set the random_page_cost setting to a value close to 1.1.
MySQLBufferPoolSizeEvent
This event tells you that the MySQL innodb_buffer_pool_size variable uses the default value of 128 MB, which is too small to cache the working set of most applications.
You should size the InnoDB buffer pool according to your working set, which is typically 50% to 75% of the memory of a dedicated database server, or enable the innodb_dedicated_server variable so that MySQL sizes the buffer pool automatically. MariaDB has no innodb_dedicated_server variable, so the event is triggered whenever the MariaDB buffer pool uses the default size.
MySQLQueryCacheEvent
This event tells you that the MySQL 5.7 or MariaDB query cache is enabled. The query cache is protected by a global mutex, and every table modification invalidates all the cached results of that table, so it becomes a bottleneck for read-write workloads. You should disable it by setting the query_cache_type variable to OFF and the query_cache_size variable to 0. MySQL 8.0 removed the query cache, while MariaDB still has it, but disables it by default since the 10.1.7 version.
MySQLWaitTimeoutEvent
This event tells you that the connection pool doesn’t retire its connections before the MySQL or MariaDB wait_timeout expires, and that it doesn’t validate or close the idle connections before the wait_timeout expires either.
In this case, the MySQL server closes the connections that stay idle in the pool before the pool retires them. If the pool validates the connections before handing them out, it needs to discard the broken connections and open new ones when the application borrows them, which adds latency to the transactions. Otherwise, the application gets the broken connections, and its transactions fail.
The check supports the following connection pools:
| Connection pool | Maximum connection lifetime | Idle connection check |
|---|---|---|
| HikariCP | maxLifetime |
keepaliveTime |
| Apache Commons DBCP2 | maxConnLifetimeMillis |
the idle connection evictor (timeBetweenEvictionRunsMillis), with testWhileIdle or minEvictableIdleTimeMillis, considering that an evictor run checks only numTestsPerEvictionRun connections |
| Agroal | maxLifetime |
the background validation (validationTimeout, or quarkus.datasource.jdbc.background-validation-interval in Quarkus), with a connection validator other than the default empty one |
| c3p0 | maxConnectionAge |
idleConnectionTestPeriod (hibernate.c3p0.idle_test_period) or maxIdleTime (hibernate.c3p0.timeout) |
| Oracle UCP | maxConnectionReuseTime |
none, since UCP doesn’t validate the idle connections, but the inactiveConnectionTimeout closes them when the minPoolSize is 0 |
| Tomcat JDBC | maxAge |
testWhileIdle, with the timeBetweenEvictionRunsMillis and validationInterval values, or minEvictableIdleTimeMillis when the minIdle is 0 |
You should set the maximum connection lifetime a few seconds lower than the MySQL wait_timeout, or make the pool check its idle connections more often than the MySQL wait_timeout.
ConnectionPoolMaxConnectionsEvent
This event tells you that the connection pool alone can open more than half of the connections the PostgreSQL, MySQL, or MariaDB server accepts, as defined by the max_connections setting, minus the PostgreSQL superuser_reserved_connections and reserved_connections.
Since every application instance has its own pool, two instances (e.g., during a rolling deployment) can exhaust the database connections, and the new connections then fail. You should lower the maximum pool size (a pool of up to 30 connections is usually enough), or use a database proxy (e.g., PgBouncer, ProxySQL) if you need more connections. The share of the database server connections a pool can open, which is 50% by default, can be changed via the hypersistence.connection_pool.max_connections_percentage property, as explained in the Thresholds section.
MySQLSlowQueryLogEvent
This event tells you that the MySQL or MariaDB slow_query_log or performance_schema setting is OFF. Unlike MySQL, MariaDB disables the Performance Schema by default. Since MariaDB 10.11, the slow_query_log and long_query_time settings are called log_slow_query and log_slow_query_time, while the old names became deprecated aliases, so the event uses the new names.
Without the slow query log, the slow queries are not logged, and without the Performance Schema, the events_statements_summary_by_digest table cannot tell you which queries consume the most execution time. You should set the slow_query_log setting to ON, along with a long_query_time threshold, and the performance_schema setting to ON, which requires a server restart.
MySQLMaxPreparedStatementCountEvent
This event tells you that the MySQL or MariaDB JDBC Driver uses server-side prepared statements (useServerPrepStmts=true) and caches them (cachePrepStmts=true), so the connection pool can keep up to prepStmtCacheSize times the maximum pool size prepared statements open on the database server, which is more than half of the server max_prepared_stmt_count limit (16382 by default).
Once the limit is reached, the database server rejects the new prepared statements of every application connected to it, and Hypersistence Optimizer knows only the connection pool of the current application node. You should lower the prepStmtCacheSize property or the pool size, or increase the max_prepared_stmt_count setting. The share of the max_prepared_stmt_count limit the pool can use, which is 50% by default, can be changed via the hypersistence.connection_pool.max_prepared_statements_percentage property, as explained in the Thresholds section.
MySQLRedoLogSizeEvent
This event tells you that the MySQL or MariaDB InnoDB redo log uses its default size, which is 100 MB for the innodb_redo_log_capacity setting since MySQL 8.0.30, and two 48 MB log files before, while MariaDB uses a single 96 MB file, given by the innodb_log_file_size setting, since the 10.5 version, so a write-heavy workload fills it quickly, and InnoDB needs to flush the dirty pages more aggressively to reuse the redo log space, which slows down the writes.
You should increase the redo log size, so that it can hold the changes of at least one hour of peak write traffic.
MySQLRepeatableReadEvent
This event tells you that the MySQL or MariaDB database connections use the default REPEATABLE-READ isolation level, for which InnoDB also takes gap and next-key locks to prevent phantom reads. These locks can cause lock waits and deadlocks, especially when the application updates or deletes records in batches.
This event is informational. If the application doesn’t rely on the Repeatable Read guarantees, you should consider the READ-COMMITTED isolation level (e.g., via the transaction_isolation setting or the hibernate.connection.isolation configuration property).
MySQLCharacterSetEvent
This event tells you that the MySQL character_set_server or character_set_database setting is utf8mb3 (or its utf8 alias), which is the legacy, deprecated, UTF-8 character set that stores up to 3 bytes per character.
So, it cannot store the 4-byte characters (e.g., emojis), and joining its columns with utf8mb4 columns converts one side, which prevents the index from being used. You should use the utf8mb4 character set.
The event is also triggered for the latin1 character set, which is the MySQL 5.7 default and the MariaDB default before the 11.6 version (the MariaDB Docker images use utf8mb4 instead), since this single-byte character set cannot store most of the Unicode characters.
OracleOpenCursorsEvent
This event tells you that the Oracle JDBC Driver statement cache size doesn’t leave enough room below the open_cursors database parameter for the cursors the application opens itself (e.g., the open ResultSet objects). Since every cached statement keeps a cursor open, a session can exceed the open_cursors limit and fail with the ORA-01000: maximum open cursors exceeded error.
The statement cache should leave 10% of the open_cursors value, but at least 10 cursors, for the application. For instance, with the open_cursors parameter set to 300, the statement cache size should be at most 270. You should either lower the statement cache size accordingly or increase the open_cursors database parameter. The minimum of 10 cursors can be changed via the hypersistence.jdbc.open_cursors_headroom property, as explained in the Thresholds section.
OracleCursorSharingEvent
This event tells you that the Oracle cursor_sharing database parameter is not set to its default EXACT value.
The FORCE value is a workaround for applications that don’t use bind parameters. Since Hibernate already uses bind parameters, it only adds parsing overhead, and the literals that should drive the execution plan end up sharing a single plan. You should set the cursor_sharing parameter to EXACT and use bind parameters in your queries, including the Criteria API ones (e.g., hibernate.criteria.literal_handling_mode=bind).
To read the Oracle database parameters, the database user needs the
SELECTprivilege on theV_$PARAMETERview. Otherwise, Hypersistence Optimizer logs a warning and skips these checks.
OracleSessionCachedCursorsEvent
This event tells you that the Oracle session_cached_cursors setting is lower than its default value of 50, so the cursors of the frequently executed statements are not kept in the session cursor cache, and every execution needs a soft parse, which uses CPU and latches the shared pool. You should increase the session_cached_cursors setting to at least 50.
OracleStatisticsLevelEvent
This event tells you that the Oracle statistics_level setting is BASIC, which disables the automatic optimizer statistics collection, the advisors (e.g., the memory advisors), and the AWR snapshots, so the optimizer might use stale statistics, and the performance issues cannot be diagnosed. You should use the default TYPICAL value.
OracleOptimizerFeaturesEnableEvent
This event tells you that the Oracle optimizer_features_enable setting is older than the database version (e.g., 12.2.0.1 on Oracle 19c), so the query optimizer cannot use the features added by the newer database versions.
This event is informational, since the setting is usually set to work around an execution plan regression after an upgrade. You should fix the affected queries instead (e.g., via a SQL plan baseline), and use the default value, which matches the database version.
SqlServerReadCommittedSnapshotEvent
This event tells you that the SQL Server READ_COMMITTED_SNAPSHOT database option is OFF, which is the default value for the on-premises SQL Server databases. In this case, the Read Committed isolation level uses shared locks, and the readers block the writers and the other way around.
You should consider enabling the READ_COMMITTED_SNAPSHOT option (e.g., ALTER DATABASE ... SET READ_COMMITTED_SNAPSHOT ON), so that the Read Committed isolation level uses row versions instead, like PostgreSQL and Oracle do. The row versions are stored in the tempdb version store, and every modified record takes 14 more bytes.
SqlServerAutoCloseEvent
This event tells you that the SQL Server AUTO_CLOSE database option is ON, so the database is closed when the last connection is closed, which removes its execution plans and data pages from memory. You should disable it (e.g., ALTER DATABASE ... SET AUTO_CLOSE OFF).
SqlServerCompatibilityLevelEvent
This event tells you that the SQL Server database compatibility level is lower than the one supported by the database server version, so the query optimizer cannot use the newer cardinality estimator and Intelligent Query Processing features.
You should test your application with the newer compatibility level and switch to it (e.g., ALTER DATABASE ... SET COMPATIBILITY_LEVEL = 160). Note that, starting with the 130 compatibility level, the DATETIME values are converted to DATETIME2 with a higher precision, as explained by the SqlServerDatetimeColumnEvent.
SqlServerQueryStoreEvent
This event tells you that the SQL Server Query Store is disabled for the current database, so you cannot find the queries that consume the most resources or the queries whose execution plans regressed, and you cannot force a previous execution plan.
You should enable it using the ALTER DATABASE CURRENT SET QUERY_STORE = ON statement. The Query Store is available since SQL Server 2016, and it’s enabled by default for the new databases since SQL Server 2022.
SqlServerPageVerifyEvent
This event tells you that the SQL Server PAGE_VERIFY database option is not CHECKSUM (e.g., it’s TORN_PAGE_DETECTION or NONE), so the database cannot detect all the pages corrupted by the storage subsystem, and the corruption can spread to the backups before anyone notices it.
You should use the ALTER DATABASE CURRENT SET PAGE_VERIFY CHECKSUM statement. The existing pages get a checksum only when they are written again.
SqlServerAutoShrinkEvent
This event tells you that the SQL Server AUTO_SHRINK database option is enabled, so the database engine shrinks the data files periodically, which fragments the indexes and uses CPU and I/O, while the files grow back as soon as new data is written.
You should disable it using the ALTER DATABASE CURRENT SET AUTO_SHRINK OFF statement.
SqlServerAutoStatisticsEvent
This event tells you that the SQL Server AUTO_CREATE_STATISTICS or AUTO_UPDATE_STATISTICS database option is disabled, so the query optimizer might use missing or stale statistics to estimate the number of rows, and it can choose a bad execution plan.
Unless a maintenance job creates and updates the statistics, you should enable both options (e.g., ALTER DATABASE CURRENT SET AUTO_UPDATE_STATISTICS ON).
SqlServerParallelismEvent
This event tells you that the SQL Server cost threshold for parallelism and max degree of parallelism server settings use their default values of 5 and 0, so even cheap queries can use parallel execution plans running on all the CPU cores, which increases the CPU usage and the parallelism waits (e.g., CXPACKET) of an OLTP workload.
This event is informational, since these settings affect all the databases of the server. You should raise the cost threshold (e.g., to a value between 30 and 50) and limit the max degree of parallelism (e.g., to the number of cores of a NUMA node, but no more than 8).
SqlServerDatabaseScopedConfigurationEvent
This event tells you that the SQL Server database uses the LEGACY_CARDINALITY_ESTIMATION = ON or the PARAMETER_SNIFFING = OFF database scoped configuration, which are usually set to work around an execution plan regression of a few queries, but they affect all the queries of the database.
This event is informational. You should fix the affected queries instead (e.g., via a Query Store plan hint), and use the default database scoped configurations, which are available since SQL Server 2016.
Dialect configuration
DialectVersionEvent
This event tells you that your application uses an older Hibernate Dialect, and you should switch to the latest Hibernate Dialect associated with the database server version your application is using.
When a MySQL Dialect is used with MariaDB, which supports database sequences since the 10.3 version, this event suggests the MariaDB Dialect that uses them, so that the entity identifiers can use the SEQUENCE strategy, which, unlike the IDENTITY one, allows Hibernate to batch the INSERT statements. Since the Hibernate 5 Dialect resolver maps the MariaDB versions it doesn’t know about (e.g., MariaDB 11) to the MariaDB53Dialect, which doesn’t support sequences, the MariaDB103Dialect or the MariaDB106Dialect is suggested instead. For Hibernate 5.1 and older, which have no MariaDB Dialect, the event is not triggered.
DialectDatabaseVersionEvent
Since Hibernate 6, the Hibernate Dialect class supports multiple database versions and enables the SQL features and optimizations available in the database version it was built for.
This event tells you that the Hibernate Dialect uses an older database version than the one of your database server. This happens when Hibernate cannot read the database version at bootstrap time, for instance, when the hibernate.boot.allow_jdbc_metadata_access configuration property is set to false. In this case, the Hibernate Dialect uses the minimum database version supported by Hibernate, unless you provide the database version explicitly.
You should allow Hibernate to read the database metadata at bootstrap time or set the jakarta.persistence.database-major-version and jakarta.persistence.database-minor-version configuration properties to the version of your database server. On Hibernate 6.0 and 6.1, these properties are used only if the jakarta.persistence.database-product-name configuration property is set as well.
On SQL Server, the Hibernate Dialect uses the database compatibility level instead of the database server version, so this event compares the Dialect version with the compatibility level, which is checked by the SqlServerCompatibilityLevelEvent.
This event is triggered for Hibernate 6 and later versions.
Driver configuration
Both MySQL Connector/J and MariaDB Connector/J can connect to MySQL and MariaDB, so the JDBC Driver checks depend on the JDBC Driver your application uses, not on the database server. For instance, the MySQLPerformancePropertiesEvent is triggered for MySQL Connector/J even if it connects to MariaDB, while the MariaDB Connector/J properties are checked even if it connects to MySQL. The MariaDB Connector/J 1.x and 2.x properties are not checked, since these versions have reached their end of life, as explained by the JdbcDriverVersionEvent.
SqlServerSendStringParametersAsUnicodeEvent
This event tells you that your application has not disabled the sendStringParametersAsUnicode
SQL Server JDBC Driver setting.
By default, the SQL Server JDBC Driver sends all String bind parameter values in Unicode format, even when the underlying column type is CHAR, VARCHAR or LONGVARCHAR.
In this case, if your SQL query uses a filter predicate on a CHAR, VARCHAR or LONGVARCHAR column that has an associated database index, the database will have to execute an expensive CONVERT_IMPLICIT action to transform the bind parameter value from the Unicode format to the original column format.
For this reason, the SQL Server JDBC Driver performance tuning page recommends disabling this default String format conversion behavior by setting the sendStringParametersAsUnicode JDBC Driver configuration property to the value of false.
If all the String entity attributes are mapped to NCHAR, NVARCHAR, or NTEXT columns, then sending the String bind parameter values in Unicode format is the right choice, and this event is not triggered.
If you disable the sendStringParametersAsUnicode setting, then the String entity attributes mapped to Unicode columns must be nationalized, as explained by the SqlServerNationalizedEntityAttributeEvent.
For more details about the sendStringParametersAsUnicode SQL Server JDBC Driver setting, check out this article.
JdbcDriverVersionEvent
This event tells you that your application uses an old JDBC Driver version that is either no longer supported or lacks important performance optimizations.
The event is triggered in the following cases:
- On MySQL or MariaDB, when using a MySQL Connector/J version older than 8, as the 5.1 JDBC Driver has reached its end of life.
- On MySQL or MariaDB, when using a MariaDB Connector/J version older than 3, as the 1.x and 2.x JDBC Driver versions have reached their end of life.
- On SQL Server, when using a Microsoft JDBC Driver version older than 6.4, which added the prepared statement handle caching, or when using the jTDS JDBC Driver, which is no longer maintained.
- On Oracle, when using an Oracle JDBC Driver version older than 19, as these versions are no longer supported.
You should upgrade to the latest JDBC Driver version that supports your database server version.
MySQLUseLocalSessionStateEvent
This event tells you that the MySQL JDBC Driver useLocalSessionState configuration property is set to false, which is the default value.
In this case, the MySQL JDBC Driver queries the database server to get the auto-commit, transaction isolation level, and read-only session state, and it sends the statements that change them even if their value does not change. Since the connection pool and the transaction manager check and set these values for every transaction, this adds extra database roundtrips to every transaction.
You should set the useLocalSessionState JDBC Driver configuration property to the value of true so that the MySQL JDBC Driver tracks the session state locally.
MySQLUseAffectedRowsEvent
This event tells you that the MySQL or MariaDB JDBC Driver useAffectedRows configuration property is set to true.
In this case, the UPDATE statements return the number of rows that were actually changed instead of the number of rows that were matched by the WHERE clause. So, when an UPDATE statement sets the same column values that the table record already has, the update count is 0, and Hibernate throws a StaleStateException or an OptimisticLockException even if the record was not modified concurrently.
You should remove the useAffectedRows JDBC Driver configuration property or set it to the value of false, which is the default value.
MariaDBUseBulkStmtsEvent
This event tells you that the MariaDB JDBC Driver useBulkStmts configuration property is set to true while Hibernate uses JDBC batching (e.g., via the hibernate.jdbc.batch_size configuration property), and the database is MariaDB.
In this case, the batched UPDATE and DELETE statements are sent using the bulk protocol, which returns a single result for the whole batch, so the JDBC Driver reports the Statement.SUCCESS_NO_INFO update count for every statement. Since Hibernate cannot check the update counts of the batched statements, it doesn’t throw a StaleStateException or an OptimisticLockException when a record was modified or deleted concurrently, so the concurrent changes are silently lost. For this reason, MariaDB Connector/J disables the useBulkStmts property by default since the 3.2 version, while it was enabled by default in the 3.0 and 3.1 versions.
You should set the useBulkStmts property to false and use the useBulkStmtsForInserts property, which sends only the batched INSERT statements using the bulk protocol. The event is not triggered for MariaDB Connector/J 3.4 or later connected to MariaDB 11.5 or later, since they return the update count of every batched statement.
MySQLDebuggingPropertiesEvent
This event tells you that the MySQL JDBC Driver debugging or profiling configuration properties are enabled, such as profileSQL, logSlowQueries, explainSlowQueries, gatherPerfMetrics, useUsageAdvisor, traceProtocol, enablePacketDebug, or autoGenerateTestcaseScript.
These properties add a significant overhead to every statement execution. For instance, the explainSlowQueries property runs an extra EXPLAIN statement for every slow query, while the autoGenerateTestcaseScript property writes every executed statement to the standard error stream.
You should enable these JDBC Driver configuration properties only while investigating an issue and disable them in production.
PostgreSQLAutosaveEvent
This event tells you that the PostgreSQL JDBC Driver autosave configuration property is set to always, or that it’s set to conservative while the cleanupSavepoints property is set to false, which is the default value.
When the autosave property is set to always, the PostgreSQL JDBC Driver sets a savepoint before executing every statement in a transaction, which adds a significant overhead. You should set the autosave property to never, which is the default value, or to conservative if you need to retry the statements that fail because a cached execution plan was invalidated by a schema change.
When the cleanupSavepoints property is false, the automatic savepoints are released only when the transaction ends. Since every savepoint starts a subtransaction, a transaction that uses more than 64 subtransactions overflows the PostgreSQL subtransaction cache, which degrades the performance of the entire database server. For this reason, you should set the cleanupSavepoints property to the value of true.
SqlServerResponseBufferingEvent
This event tells you that the SQL Server JDBC Driver responseBuffering configuration property is set to full.
In this case, the JDBC Driver reads the entire result set into memory when executing a statement, which increases the memory consumption and the response time of the queries that return large result sets.
You should remove the responseBuffering JDBC Driver configuration property or set it to the value of adaptive, which is the default value and reads the result set as the application iterates over it.
SqlServerSelectMethodEvent
This event tells you that the SQL Server JDBC Driver selectMethod configuration property is set to cursor.
In this case, the JDBC Driver creates a server-side cursor for every query, and it requires a database roundtrip to fetch every block of records.
You should remove the selectMethod JDBC Driver configuration property or set it to the value of direct, which is the default value.
SqlServerSendTimeAsDatetimeEvent
This event tells you that the SQL Server JDBC Driver sendTimeAsDatetime configuration property is set to true, which is the default value, while there are entity attributes mapped to TIME columns.
In this case, the JDBC Driver sends the time bind parameter values as DATETIME, and the queries filtering by a TIME column fail with the “The data types time and datetime are incompatible in the equal to operator” error.
You should set the sendTimeAsDatetime JDBC Driver configuration property to the value of false.
JdbcSocketTimeoutEvent
This event tells you that the database connections have no network timeout, as reported by the JDBC Connection#getNetworkTimeout() method, so a thread waiting for a query result stays blocked if the TCP connection is silently dropped (e.g., by a firewall, a NAT gateway, or because the database server crashed).
A server-side statement timeout doesn’t help in this case, since the database server cannot notify the client over a dead connection. You should set the network timeout to a value greater than the duration of the longest query your application executes:
| Database | JDBC Driver property |
|---|---|
| PostgreSQL | socketTimeout, in seconds. Since the tcpKeepAlive property is disabled by default, the thread stays blocked forever otherwise. |
| MySQL | socketTimeout, in milliseconds. The tcpKeepAlive property is enabled by default, but the operating system detects a dead connection only after the TCP keepalive time, which is 2 hours by default on Linux. |
| MariaDB | socketTimeout, in milliseconds. The tcpKeepAlive property is enabled by default, but the operating system detects a dead connection only after the TCP keepalive time, which is 2 hours by default on Linux, unless the tcpKeepIdle property lowers it. |
| SQL Server | socketTimeout, in milliseconds, or the queryTimeout property together with the cancelQueryTimeout property. |
| Oracle | oracle.jdbc.ReadTimeout, in milliseconds. The oracle.net.CONNECT_TIMEOUT property limits only the connection establishment. |
JdbcApplicationNameEvent
This event tells you that the database connections use the default JDBC Driver application name, so the database monitoring tools cannot tell which application executes a given statement. When multiple applications or services use the same database, you need the application name to find which one causes a slow query, a lock, or a connection leak.
You should set the PostgreSQL ApplicationName, the SQL Server applicationName, or the Oracle v$session.program JDBC Driver property to the name of your application. Then, the application name is displayed by the pg_stat_activity view, the SQL Server sys.dm_exec_sessions view and Query Store reports, or the Oracle V$SESSION view, AWR, and ASH.
MySQL Connector/J and MariaDB Connector/J send the application name as the program_name connection attribute, which the performance_schema.session_connect_attrs table displays, so the event is triggered when the connectionAttributes property doesn’t define it. You should add the program_name attribute to the connectionAttributes property (e.g., connectionAttributes=program_name:billing). Since the Performance Schema is disabled by default on MariaDB, you also need to enable it, as explained by the MySQLSlowQueryLogEvent.
PostgreSQLBinaryTransferEvent
This event tells you that the PostgreSQL JDBC Driver binaryTransfer property is disabled, so the numeric and temporal values are transferred as text, and both the database server and the JDBC Driver need to format and parse them. You should remove the binaryTransfer property since its default value is true.
PostgreSQLLogUnclosedConnectionsEvent
This event tells you that the PostgreSQL JDBC Driver logUnclosedConnections property is enabled, so the driver captures a stack trace every time it opens a database connection, to log it if the connection is garbage-collected without being closed.
You should enable the logUnclosedConnections property only while looking for a connection leak, or use the leak detection of the connection pool instead (e.g., the HikariCP leakDetectionThreshold).
MySQLPerformancePropertiesEvent
This event tells you that the MySQL JDBC Driver uses the default value of the properties that avoid the statements, or the work, a typical application doesn’t need, as recommended by the HikariCP MySQL configuration:
elideSetAutoCommits=true, so that theSET autocommitstatement is sent only if the auto-commit mode changes,useLocalTransactionState=true, so that theCOMMITandROLLBACKstatements are skipped when there’s no transaction to end,cacheServerConfiguration=true, so that the server variables and collations are not read for every new connection,cacheResultSetMetadata=true, so that theResultSetmetadata is reused when the same query is executed again,maintainTimeStats=false, so that the driver doesn’t track the timing statistics of every statement.
The event lists the properties that don’t use the recommended value, so a default MySQL JDBC Driver configuration triggers a single event. The elideSetAutoCommits property is not checked for Connector/J 5.1, which ignores it.
MySQLUseCompressionEvent
This event tells you that the MySQL or MariaDB JDBC Driver useCompression property is enabled, so the driver and the database server compress every packet, which takes CPU time on both sides. On a local network, the compression usually costs more than the network time it saves.
You should disable the useCompression property, unless the application connects to the database over a slow network (e.g., a WAN link).
SqlServerLastUpdateCountEvent
This event tells you that the SQL Server JDBC Driver lastUpdateCount property is disabled, so the update count returned by a statement that fires a trigger can be the update count of a statement executed by the trigger.
Hibernate uses the update count to check that the entity row was modified (e.g., the optimistic locking check), so it might throw a StaleStateException for a successful update or miss a lost update. You should remove the lastUpdateCount property since its default value is true.
SqlServerPreparedStatementDiscardThresholdEvent
This event tells you that the SQL Server JDBC Driver serverPreparedStatementDiscardThreshold property is lower than 2, so the driver unprepares the server-side prepared statement handles one by one, which takes an extra database round trip (sp_unprepare) for every closed PreparedStatement.
You should use the default value of 10, or a higher value, so that the prepared statement handles are unprepared in batches.
SqlServerDelayLoadingLobsEvent
This event tells you that the SQL Server JDBC Driver delayLoadingLobs property is disabled, so the driver loads every LOB value (e.g., VARCHAR(MAX), NVARCHAR(MAX), VARBINARY(MAX)) into memory when it reads the record, even if the application reads the value as a stream.
You should remove the delayLoadingLobs property since its default value is true, so that the LOB values are streamed from the database.
OracleLobPrefetchSizeEvent
This event tells you that the Oracle JDBC Driver oracle.jdbc.defaultLobPrefetchSize property uses the default value of the JDBC Driver version (e.g., 4000 bytes for the 18c JDBC Driver), while the entities map LOB columns. When a LOB value is larger than the prefetch size, the JDBC Driver needs extra database round trips to read the rest of the value.
This event is informational, as the LOB value sizes are not known. If most of the LOB values are larger than the prefetch size, you should increase the oracle.jdbc.defaultLobPrefetchSize property, so that the LOB values are fetched together with the record. The event needs the database scanner, since the LOB columns are read from the database catalog.
Envers configuration
DefaultAuditStrategyEvent
This event tells you that your application is using the Hibernate Envers DefaultAuditStrategy, which is not very efficient when it comes to generating the audit log queries. Therefore, it’s worth using the ValidityAuditStrategy instead. However, switching the audit log strategy requires changing the audit log tables, so take this into consideration prior to changing the strategy.
For more details about the Hibernate Envers ValidityAuditStrategy, check out this article.
Fetching configuration
JdbcFetchSizeEvent
For database systems which, by default, fetch the entire JDBC ResultSet in a single database roundtrip and cache it on the client-side (e.g., PostgreSQL, MySQL), there is no need to set the hibernate.jdbc.fetch_size configuration property.
However, if you’re using Oracle which, by default, uses a JDBC Statement fetch size of just 10, you might want to set the hibernate.jdbc.fetch_size configuration property to a value that’s greater than 10 as Hibernate could use fewer database roundtrips when iterating a JDBC ResultSet that contains multiple entities or DTO projections.
On Oracle, this event is not triggered if you have already increased the default fetch size via the defaultRowPrefetch JDBC Driver configuration property, or if you’re using the 23ai JDBC Driver or newer, which adapts the fetch size automatically when the application doesn’t set it.
However, if you increased the defaultRowPrefetch JDBC Driver configuration property and you also set the hibernate.jdbc.fetch_size configuration property, then this event tells you to remove the hibernate.jdbc.fetch_size configuration property. The Hibernate setting overrides the JDBC Driver one for the statements executed by Hibernate, while the defaultRowPrefetch setting applies to all statements, not just to the ones executed by Hibernate, so you are better off using only the defaultRowPrefetch setting.
For more details about the hibernate.jdbc.fetch_size configuration property, check out this article.
TempSessionLazyLoadingEvent
You should not enable the hibernate.enable_lazy_load_no_trans configuration property as Hibernate will then open a temporary Session and database transaction to fetch each individual lazy association that was not initialized in the original and now closed Hibernate Session or JPA EntityManager.
Instead, you should always fetch all associations that you need to process in the context of a single database transaction and JPA Persistence Context.
For more details about the hibernate.enable_lazy_load_no_trans configuration property, check out this article.
Entity identifier configuration
PooledSequenceOptimizerEvent
You should enable the hibernate.id.new_generator_mappings configuration property so that Hibernate can use the pooled or pooled-lo identifier optimizers for sequence-based entity identifiers.
Note that the pooled and pooled-lo optimizers are not backward compatible with the legacy hilo optimizer that you might have used with Hibernate ORM 3 or 4. So, if you were using the hilo optimizer, then you would need to increase the current sequence number, so that it’s greater than any previously allocated entity identifiers.
This property used to be disabled prior to Hibernate 5, so you might want to enable it for legacy Hibernate versions. For Hibernate 5 and later versions, you don’t need to set this property as it’s enabled by default.
Logging configuration
ConsoleStatementLoggingEvent
By enabling the hibernate.show_sql configuration property, SQL statements are going to be printed in the console, and that’s not a good idea.
You should remove this property and set the org.hibernate.SQL logger on the DEBUG level. Even better than Hibernate-based logging, a JDBC DataSource logging framework (e.g., datasource-proxy) is a much more flexible option.
For more details about the best way to log SQL statements, check out this article.
MultiLineStatementLoggingEvent
By enabling the hibernate.format_sql configuration property, Hibernate is going to format the SQL statement and log it on multiple lines. You should consider removing this property if you are using a log parser that does not support multiline parsing.
SqlCommentStatementLoggingEvent
By enabling the hibernate.use_sql_comments configuration property, Hibernate is going to append an SQL comment to the auto-generated statements. You should remove this property since, besides increasing the networking overhead, it can also affect the effectiveness of the statement caching mechanism.
SessionMetricsLoggingEvent
From Hibernate 4.2 to 6.6, the hibernate.session.events.log configuration property defaults to the value of the hibernate.generate_statistics configuration property. So, if you enable the Hibernate statistics, Hibernate also logs the JDBC, cache, and flush metrics of every closed Session on the INFO level, which adds a log entry per transaction.
This event tells you that Hibernate logs these Session metrics, and you should set the hibernate.session.events.log configuration property to the value of false, or set the org.hibernate.engine.internal.StatisticalLoggingSessionEventListener logger to the WARN level.
Since Hibernate 7, the hibernate.session.events.log configuration property is no longer used, and the Session metrics are logged only if the org.hibernate.session.metrics logger is set to the DEBUG level, so this event is triggered from Hibernate 4.2 to 6.6 only.
Query configuration
CriteriaQueryLiteralHandlingModeEvent
You should set the hibernate.criteria.literal_handling_mode configuration property to the value of BIND, as Hibernate can then use bind parameter values instead of inlining the literal value. This strategy gives you a better chance to reuse an already generated SQL execution plan when varying the literal value.
For more details about the hibernate.criteria.literal_handling_mode configuration property, check out this article.
CriteriaQueryPlanCacheEvent
Since Hibernate 7, the Criteria API queries are not stored in the Query Plan Cache by default, so Hibernate compiles every Criteria API query on every execution, even if the JPQL queries reuse their cached plans.
This event tells you that you should set the hibernate.criteria.plan_cache_enabled configuration property to the value of true. This is especially useful when using the Spring Data JPA Specifications or Query by Example, which are built with the Criteria API. Prior to Spring Data JPA 4.0, the query methods derived from the method name are built with the Criteria API as well, while Spring Data JPA 4.0 renders them as JPQL queries, which use the Query Plan Cache no matter the hibernate.criteria.plan_cache_enabled setting.
If your application builds many Criteria API queries whose structure varies from one execution to the next, they can fill the Query Plan Cache and evict the plans of the other queries. In this case, you should also increase the hibernate.query.plan_cache_max_size configuration property, as explained by the DefaultQueryPlanCacheMaxSizeEvent.
This event is not triggered when the Criteria API literals are inlined (e.g., hibernate.criteria.value_handling_mode is set to inline), as every literal value would then add a new Query Plan Cache entry.
DefaultQueryPlanCacheMaxSizeEvent
The default maximum size of the Hibernate Query Plan Cache is 2048, and every query execution creates an entry in the Query Plan Cache.
The main advantage of the Query Plan Cache is that it allows us to avoid parsing JPQL, Criteria API, or collection filter queries on every execution. Once an entity query is compiled, Hibernate stores its associated AST (Abstract Syntax Tree) in the Query Plan Cache, so the next execution will get the AST from the cache, therefore skipping the entity query compilation.
However, SQL queries generate Query Plan Cache entries too in order to reuse the named parameter binding strategy. While the difference between a cache hit and a miss is not as significant for an SQL query, as it’s the case for entity queries, the SQL query cache entry is stored in the same Query Plan Cache.
So, the default Query Plan Cache size of 2048 might not be enough for a non-trivial application, and, for this reason, you should set the hibernate.query.plan_cache_max_size (or hibernate.query.plan_cache_max_soft_references in Hibernate 3.6) configuration property to a value that allows you to hold all JPQL, Criteria API, or SQL queries executed via JPA and Hibernate.
Starting with Hibernate 5.4, the Hibernate Statistics mechanism allows you to monitor the Query Plan Cache via the getQueryPlanCacheHitCount and getQueryPlanCacheMissCount methods.
For more details about the hibernate.query.plan_cache_max_size configuration property, check out this article.
QueryInClauseParameterPaddingEvent
You should set the hibernate.query.in_clause_parameter_padding configuration property to the value of true, as Hibernate entity queries can then make better use of statement caching, and fewer entity queries will have to be compiled while varying the number of parameters passed to the in query clause.
For more details about the hibernate.query.in_clause_parameter_padding configuration property, check out this article.
QueryPaginationCollectionFetchingEvent
You should set the hibernate.query.fail_on_pagination_over_collection_fetch configuration property to the value of true, as Hibernate can then prevent in-memory pagination when join fetching a child entity collection.
To find the queries that Hibernate paginates in memory, check out the PaginationWithCollectionFetchEvent.
For more details about the hibernate.query.fail_on_pagination_over_collection_fetch configuration property, check out this article.
Since Hibernate 7.4, this event is no longer triggered when the dialect supports an offset in a derived table, as Hibernate then paginates the parent entities in a derived table and join fetches their collections in the outer SQL query. For more details, check out the HHH-19933 issue.
QueryPlanCacheDisabledEvent
This event tells you that the hibernate.query.plan_cache_enabled configuration property is set to false, so Hibernate has to compile every JPQL, Criteria API, or SQL query on every execution.
You should remove this configuration property and set the size of the Query Plan Cache using the hibernate.query.plan_cache_max_size configuration property, as explained by the DefaultQueryPlanCacheMaxSizeEvent. While the Query Plan Cache is disabled, the DefaultQueryPlanCacheMaxSizeEvent and the CriteriaQueryPlanCacheEvent are not triggered.
This event is triggered for Hibernate 6 and later versions.
Schema configuration
SchemaGenerationEvent
You should not use Hibernate to manage your database schema. Instead, you should use an incremental schema migration tool (e.g., Flyway, Liquibase), which allows you to use database-specific DDL constructs. By storing the migration scripts in the Version Control System along with the application source code, you will always remember why a certain schema change was done.
Statement caching configuration
JdbcStatementCacheSizeEvent
JDBC Statement caching allows you to reuse the statement metadata when executing the same statement over and over again. By using statement caching, you can reduce transaction response time and increase throughput.
The JDBC Drivers allow you to configure statement caching, so you should definitely activate this feature as well. Depending on the number of statements you are executing, you need to set the statement cache size accordingly.
A statement cache size of 256 is a good default value. Consider lowering the statement cache size if you don’t have enough memory and increasing it if you have plenty of memory and need to execute lots of distinct SQL statements. The recommended statement cache size of 256 can be changed via the hypersistence.jdbc.statement_cache_size property, as explained in the Thresholds section.
Depending on the database you are using, the statement cache is configured as follows:
- On Oracle, you need to set the
oracle.jdbc.implicitStatementCacheSizeJDBC Driver configuration property or, if you’re using the Oracle Universal Connection Pool, themaxStatementsproperty of thePoolDataSource. Since every cached statement keeps a database cursor open, the statement cache size must be lower than theopen_cursorsdatabase setting, as, otherwise, you risk getting theORA-01000: maximum open cursors exceedederror. If Hypersistence Optimizer can read theopen_cursorsdatabase parameter, the recommended statement cache size leaves room for the cursors the application opens itself, as explained by the OracleOpenCursorsEvent, so it can be lower than256. - On SQL Server, you need to set the
disableStatementPoolingJDBC Driver configuration property to the value offalseand thestatementPoolingCacheSizeproperty to the cache size. - On PostgreSQL, the statement cache is enabled by default, and its size is given by the
preparedStatementCacheQueriesJDBC Driver configuration property. This event is also triggered when thepreferQueryModeproperty is set tosimple, theprepareThresholdproperty is set to0, or thepreparedStatementCacheSizeMiBproperty is set to0, since these settings disable the server-side prepared statements or the statement cache. Because theprepareThreshold=0setting is often used on purpose with PgBouncer in transaction pooling mode, this cause is reported with theMAJORpriority instead of theCRITICALone. - On MySQL, you need to set the
cachePrepStmtsJDBC Driver configuration property to the value oftrueand theprepStmtCacheSizeproperty to the cache size. - With MariaDB Connector/J, the statement cache holds only the server-side prepared statements, so this event is triggered only if the
useServerPrepStmtsproperty is set totrue, which is not the default, while thecachePrepStmtsproperty is set tofalseor theprepStmtCacheSizeproperty is lower than the recommended cache size. Since the defaultprepStmtCacheSizevalue of250is close enough to the default recommended cache size, a cache size of at least250is accepted, unless you set a custom statement cache size threshold.
Hypersistence Optimizer reads the JDBC Driver settings from the database connection, so these checks work no matter if you provide the JDBC Driver configuration properties via the JDBC URL, the DataSource setters, or the connection pool settings (e.g., the HikariCP dataSource.* properties).
For more details about why you should enable statement caching, check out this article.
JdbcStatementCacheSqlLimitEvent
The MySQL JDBC Driver caches only the statements that are not longer than the prepStmtCacheSqlLimit JDBC Driver configuration property value, which is 256 characters by default.
Since most SQL statements generated by Hibernate are longer than that, they are never cached, even if the cachePrepStmts property is set to the value of true. For this reason, you should set the prepStmtCacheSqlLimit property to the value of 2048, or even higher if your application executes longer SQL statements. The recommended prepStmtCacheSqlLimit value of 2048 can be changed via the hypersistence.jdbc.statement_cache_sql_limit property, as explained in the Thresholds section.
SqlServerPrepareMethodEvent
This event tells you that the SQL Server JDBC Driver prepareMethod configuration property is not set to its default prepexec value.
When using the prepare method, the JDBC Driver calls the sp_prepare stored procedure prior to executing a statement, which requires an extra database roundtrip. When using the none or scopeTempTablesToConnection methods, the JDBC Driver does not create the server-side prepared statement handles that could be reused when executing the same statement again.
You should remove the prepareMethod JDBC Driver configuration property or set it to the value of prepexec, which prepares and executes a statement in a single database roundtrip using the sp_prepexec stored procedure.
Statistics configuration
StatisticsGenerationEvent
This event tells you that the hibernate.generate_statistics configuration property is set to true, so Hibernate collects statistics for every entity, collection, query, and second-level cache operation, which adds an overhead to every Session.
If you use these statistics (e.g., to export them as Micrometer metrics), you can ignore this event. Otherwise, you should disable the Hibernate statistics in production. From Hibernate 4.2 to 6.6, enabling the statistics also logs the metrics of every Session, as explained by the SessionMetricsLoggingEvent.
This event is triggered for every Hibernate version.
Runtime events
The runtime events are generated when running a JPA EntityManager or Hibernate Session or when executing queries.
Session events
EntityAlreadyManagedEvent
Managed entities are automatically checked by Hibernate when the Persistence Context is flushed.
Calling merge, save, saveOrUpdate, or update for managed entities is redundant, and the operation should be removed as it only adds an extra overhead with no real benefit.
For more details about the redundant merge anti-pattern, check out this article.
FlushModeAutoEvent
The Hibernate Session uses the legacy FlushMode.AUTO strategy, that does not guarantee read-your-writes consistency for native SQL queries.
When using the default FlushMode.AUTO, Hibernate does not flush the Persistence Context prior to executing an SQL query, so the pending entity changes will not be visible to the query execution.
You should consider setting the flushMode property of the current running Session or Query to the value of ALWAYS.
Since Hibernate 5.2, you can also set the org.hibernate.flushMode Hibernate configuration property to the value of always, and all Session instances will use the FlushMode.ALWAYS strategy instead of the default FlushMode.AUTO.
You can set the org.hibernate.flushMode Hibernate configuration property like this:
<property
    name="org.hibernate.flushMode"
    value="always"
/>
NPlusOneQueryCollectionFetchingEvent
The NPlusOneQueryCollectionFetchingEvent indicates that a collection has been initialized using multiple secondary SQL queries during the lifetime of the current Persistence Context (JPA EntityManager or Hibernate Session), instead of being fetched in one query along with its parent entities.
This issue can happen with both FetchType.EAGER and FetchType.LAZY collections, for instance, when iterating the parent entities and accessing their collections.
Batch fetching, which is enabled via the @BatchSize annotation or the hibernate.default_batch_fetch_size configuration property, only reduces the number of secondary queries since every query can initialize several collections at once. For instance, initializing the collections of 100 parent entities with a batch size of 16 still requires 7 secondary queries. For this reason, the event reports the number of secondary queries that were executed, not the number of initialized collections.
Collections that are initialized from the second-level cache don’t trigger this event since no secondary SQL query is executed.
To fix this issue, fetch the collection along with its parent entities using a JOIN FETCH clause. If you need to fetch multiple collections, use a separate JOIN FETCH query for each collection to avoid a Cartesian Product.
For more details about the N+1 query issue, check out this article.
NPlusOneQueryEntityFetchingEvent
The NPlusOneQueryEntityFetchingEvent indicates that an entity has been fetched using multiple secondary SQL queries using secondary SQL queries instead of being fetched in one query using a JOIN FETCH clause.
N+1 query issues can cause significant performance issues because, even if each query is fast to execute, doing that tens or hundreds of times just adds up, and the more the data grows with time, the bigger the performance penalty will get.
That’s why a slow query log might not help identify N+1 query issues, and you’d eventually spot them using query execution statistics after the production system is already affected.
For more details about the N+1 query issue, check out this article.
OptimisticLockModeEvent
The OptimisticLockModeEvent indicates that a managed entity was locked using the javax.persistence.LockModeType#OPTIMISTIC mode without having the associated database record locked with the javax.persistence.LockModeType#PESSIMISTIC_READ or javax.persistence.LockModeType#PESSIMISTIC_WRITE strategy.
Without locking the underlying record, there’s a window of opportunity between the version check and the transition commit, in which time the entity could still be changed by a concurrent transaction, therefore defeating the purpose of this optimistic locking mechanism.
Ideally, the javax.persistence.LockModeType#PESSIMISTIC_READ or javax.persistence.LockModeType#PESSIMISTIC_WRITE should be acquired right before exiting the service method that triggers the transaction commit, like in the following example:
@Transactional
public PurchaseOrder orderProduct(Long productId, int quantity) {
    Product product = entityManager.find(
        Product.class,
        productId,
        LockModeType.OPTIMISTIC
    );
⠀
    PurchaseOrder order = new PurchaseOrder()
        .setProduct(product)
        .setQuantity(quantity);
⠀
    entityManager.persist(order);
⠀
    entityManager.lock(product, LockModeType.PESSIMISTIC_READ);
⠀
    return order;
}
For more details about the redundant merge anti-pattern, check out this article.
RedundantSessionFlushEvent
The RedundantSessionFlushEvent indicates that the current Persistence Context (JPA EntityManager or Hibernate Session) has been flushed without triggering any entity modification.
If a read-write transaction doesn’t change any entity, then you could switch to using a read-only Session that doesn’t need to pay the overhead of flushing entities.
For more details about read-only Session optimization, check out this article.
SecondaryQueryEntityFetchingEvent
The SecondaryQueryEntityFetchingEvent indicates that an entity has been fetched using a secondary SQL query instead of being loaded using a JOIN FETCH clause along with its parent entity.
This issue can happen with both FetchType.EAGER and FetchType.LAZY associations, and since secondary queries can easily turn into N+1 query issues, this anti-pattern should be avoided.
For more details about the N+1 query issue, check out this article.
SessionFlushTimeoutEvent
The SessionFlushTimeoutEvent indicates that the current Persistence Context (EntityManager or org.hibernate.Session) has been flushed for more than the maximum allowed time threshold, which is given by the hypersistence.session.flush_timeout_millis property value.
The more entities the current Persistence Context is managing, the longer it takes to process the dirty checking mechanism and synchronize the entity state changes with the database.
The flush execution time impacts the overall transaction response time, so you need to make sure that the current JPA EntityManager or Hibernate Session doesn’t contain a very large number of entities.
The default value is set to 1 second and can be overridden on a per-Persistence Context or Persistence Unit basis via the hypersistence.session.flush_timeout_millis runtime property. You can also change the default value using the setSessionFlushTimeoutMillis method of the ConfigThresholds builder, as explained in the Thresholds section.
Check out the runtime configuration properties section for more details about how you can customize this property value.
SessionTimeoutEvent
Running the org.hibernate.Session or javax.persistence.EntityManager for too long is to be avoided because it impacts user experience, consumes resources, and prevents other concurrent requests from using the acquired resources (e.g., database connections).
By default, the Persistence Context timeout value is set to 3 seconds. This value was chosen based on this report published by Google, which states that:
53% of visits are abandoned if a mobile site takes longer than three seconds to load.
— Google Data, Global, Mar. 2016.
The default value can be overridden on a per-Persistence Context or Persistence Unit basis. You can also change the default value using the setSessionTimeoutMillis method of the ConfigThresholds builder, as explained in the Thresholds section.
Check out the runtime configuration properties section for more details about how you can customize this property value.
StatelessSessionJdbcBatchSizeEvent
This event tells you that a Hibernate 7 StatelessSession executes the entity inserts, updates, or deletes one by one, although the hibernate.jdbc.batch_size configuration property is set, since, starting with Hibernate 7, this property has no effect on a StatelessSession.
You should use the StatelessSession insertMultiple, updateMultiple, or deleteMultiple methods, which batch the statements, or call the StatelessSession#setJdbcBatchSize method. The event is triggered once per SessionFactory.
TableRowAlreadyManagedEvent
The TableRowAlreadyManagedEvent indicates that a given database table row is managed by an entity that was already bound to the current Persistence Context.
When having multiple entities mapped to the same database table, it’s important to load at most one entity that manages a given record.
Otherwise, you could end up having data consistency issues at flush time since multiple entity objects would synchronize the same table record time with different entity states.
TransactionlessSessionEvent
The TransactionlessSessionEvent indicates that the current Persistence Context is not running in a transactional context, and for this reason, it has acquired multiple JDBC Connection objects to execute various SQL queries.
By using a transactional org.hibernate.Session or javax.persistence.EntityManager, you can reuse the same JDBC Connection for all SQL statements that get executed.
Connection events
AutoCommittingConnectionEvent
The AutoCommittingConnectionEvent indicates that a JDBC java.sql.Connection was borrowed in auto-commit mode.
Borrowing a JDBC java.sql.Connection from the pool in auto-commit mode should be avoided as Hibernate needs to disable that mode and enforce explicit transaction boundaries.
StatementlessConnectionEvent
The StatementlessConnectionEvent indicates that a JDBC java.sql.Connection was borrowed without executing any SQL statement.
Borrowing a JDBC java.sql.Connection from the pool without executing any SQL statement should be avoided as it deprives other concurrent requests of using this connection.
The SQL statements executed outside Hibernate, on the java.sql.Connection of the current Persistence Context, are taken into consideration as well. For instance, the statements executed via the Hibernate Session#doWork and Session#doReturningWork methods, or the ones executed by Spring JdbcTemplate or jOOQ when they share the JPA transaction connection (e.g., via the Spring JpaTransactionManager), don’t trigger this event. For this purpose, Hypersistence Optimizer decorates the java.sql.Connection acquired by Hibernate so that it can detect the statements created on it, while the connection pool gets back the original java.sql.Connection.
The decorated
java.sql.Connectionis a JDK proxy that implements thejava.sql.Connectioninterface, as well as the other public interfaces of the originaljava.sql.Connection. So, if your code casts thejava.sql.Connectionprovided bySession#doWorkor by the SpringJpaTransactionManagerto a JDBC Driver or connection pool class (e.g.,(PgConnection) connection), it throws aClassCastException. In this case, you should use theConnection#unwrapmethod instead (e.g.,connection.unwrap(PgConnection.class)), which the proxy delegates to the originaljava.sql.Connection.If you can’t change this code, you can disable the runtime checks, which also disables the
java.sql.Connectiondecoration, either via thesetRuntimeScannerEnabled(false)configuration method or via thehypersistence.enable_auto_session_factory_decoration=falseproperty, as explained in the Installation Guide.
TransactionReconnectionEvent
The TransactionReconnectionEvent indicates that a JDBC java.sql.Connection is borrowed multiple times during the lifetime of a given JPA or Hibernate transaction.
Ideally, you should borrow a JDBC java.sql.Connection from the pool only once when executing a JPA or Hibernate transaction.
To help you find what borrowed the connection again, the event reports the borrowed java.sql.Connection, the application caller that triggered the connection acquisition (e.g., an @TransactionalEventListener or a transaction Synchronization that runs a query after the transaction was committed), and the first five SQL statements executed on that connection, including the ones executed via a plain java.sql.Statement (e.g., by the Spring JdbcTemplate methods that take no SQL parameters):
The JDBC Connection was borrowed for [3] ms for management purposes while the transaction status was [COMMITTED]. The borrowed connection was [com.zaxxer.hikari.pool.HikariProxyConnection@1b2c3d4e wrapping org.postgresql.jdbc.PgConnection@5d1b9c3d]. The connection was acquired by [com.acme.OrderService.onOrderPlaced(OrderService.java:42)]. The following SQL statements were executed on the connection: [select o1_0.id,o1_0.status from orders o1_0 where o1_0.id=?].
The borrowed connection is described by its class name and identity hash code, as well as the ones of the physical connection when the connection pool exposes it, which is how connection pools like HikariCP log the physical connections. The toString method of the connection is not used, as some JDBC Drivers and connection pools include the JDBC URL and the database user in it.
The application caller is the first stack frame that belongs to the application package, which is given by the first two package segments of the class that instantiates the HypersistenceOptimizer (e.g., com.acme for the com.acme.config.PersistenceConfiguration class). If this class belongs to a framework package, like the org.springframework.samples.petclinic.HypersistenceConfiguration class of the Spring Petclinic application, the application package gets one more segment (e.g., org.springframework.samples). If no stack frame belongs to the application package, the first stack frame that does not belong to the JDK, a framework, a connection pool, or a transaction manager is reported.
The same information is available via the getConnection, getCaller, and getStatements methods of the TransactionReconnectionEvent, and, when the events are stored in the database, the events triggered by different application caller methods are aggregated separately.
Query events
MassQueryCacheInvalidationEvent
When the query cache is enabled, native SQL statements that don’t explicitly specify the table spaces they are affecting will end up invalidating the entire query cache.
For this reason, if you are using the query cache, then when executing a native SQL query that modifies data by calling the executeUpdate method on the Query object, then you need to make sure you define the affected tables via one of the following three methods:
MySQLResultSetStreamingEvent
This event is triggered when a query result set is scrolled or streamed (e.g., using the Hibernate Query scroll method or the JPA Query getResultStream method), but the MySQL JDBC Driver fetches the entire result set into memory.
By default, the MySQL JDBC Driver loads the entire result set into memory, so scrolling or streaming a large result set doesn’t reduce the application memory footprint. The MySQL JDBC Driver streams the result set only if the ResultSet is forward-only (e.g., ScrollMode.FORWARD_ONLY or the Stream API) and either:
- the query fetch size is set to
Integer.MIN_VALUE, so that the rows are streamed one by one, - or the
useCursorFetchJDBC Driver property is set totrueand the query fetch size is greater than0(e.g., using theorg.hibernate.fetchSizequery hint), so that the rows are fetched in chunks using a server-side cursor.
MariaDBResultSetStreamingEvent
This event is triggered when a query result set is scrolled or streamed (e.g., using the Hibernate Query scroll method or the JPA Query getResultStream method), but the MariaDB JDBC Driver fetches the entire result set into memory.
Unlike the MySQL JDBC Driver, the MariaDB JDBC Driver streams the result set whenever the fetch size is greater than 0, fetching the rows in chunks of the fetch size, without requiring a server-side cursor. So, the event is triggered when the fetch size is 0, which is the default value, or when the ResultSet is scrollable, since a scrollable ResultSet loads the remaining rows when it’s scrolled backward or to an absolute position.
Also, unlike the MySQL JDBC Driver, which throws an exception for a result set streamed row by row, the MariaDB JDBC Driver loads the remaining rows into memory when another statement is executed on the same connection while the result set is streamed. So, you should avoid initializing lazy associations or executing other queries, which can also trigger an automatic flush, while streaming the result set.
You should use a forward-only ResultSet (e.g., ScrollMode.FORWARD_ONLY or the Stream API) and set the query fetch size (e.g., using the org.hibernate.fetchSize query hint) or the defaultFetchSize JDBC Driver property to a value greater than 0.
PaginationWithCollectionFetchEvent
This event is triggered when a paginated JPQL or Criteria API query (e.g., using the setFirstResult or setMaxResults methods) fetches a child entity collection via JOIN FETCH.
Since limiting the SQL result set would truncate the child collections, Hibernate fetches the entire result set from the database and applies the pagination in memory, logging the firstResult/maxResults specified with collection fetch; applying in memory warning message. So, as the tables grow, the query fetches more and more records, which makes it slower and increases the application memory footprint.
To fix it, you should fetch the paginated parent entity identifiers first, and then fetch the parent entities along with their child collections using a second query that filters by the previously fetched identifiers. For more details, check out this article.
Since Hibernate 7.4, this event is no longer triggered when the dialect supports an offset in a derived table, as Hibernate then paginates the parent entities in SQL. To make Hibernate throw an exception instead of applying the pagination in memory, check out the QueryPaginationCollectionFetchingEvent.
PaginationWithoutOrderByEvent
When executing a JPQL, Criteria API, or native SQL query that uses pagination, you have to provide an ORDER BY clause so that the result set entries are sorted.
Without an ORDER BY clause, the result is not deterministic since SQL does not guarantee any particular ordering by default.
PassDistinctThroughEvent
In a JPA entity query, be it JPQL or Criteria API, the DISTINCT keyword has two meanings.
For scalar projection queries, the DISTINCT JPA entity query keyword needs to be passed to the underlying SQL query in order to remove duplicates when fetching the result set.
For example, when extracting the YEAR from a TIMESTAMP, using DISTINCT will allow us to remove duplicate YEARS associated with all timestamp values that belong to the same year.
However, if the entity query fetches parent entities along with their child associations, DISTINCT is used to deduplicate the Java entity object references that would, otherwise, be returned to the client. In this case, we don’t want the DISTINCT keyword to be passed to the underlying SQL query since there is no duplicate record in the result set (each child record Primary Key is unique anyway).
So, for entity queries that use DISTINCT to remove duplicate Java entity references, you need to set the hibernate.query.passDistinctThrough JPA query hint to false.
For more details about this topic, check out this article.
PostgreSQLResultSetStreamingEvent
This event is triggered when a query result set is scrolled or streamed (e.g., using the Hibernate Query scroll method or the JPA Query getResultStream method), but the PostgreSQL JDBC Driver fetches the entire result set into memory.
By default, the PostgreSQL JDBC Driver loads the entire result set into memory, so scrolling or streaming a large result set doesn’t reduce the application memory footprint. The PostgreSQL JDBC Driver fetches the result set in chunks of rows using a database cursor only if all the following conditions are met:
- the
ResultSetis forward-only (e.g.,ScrollMode.FORWARD_ONLYor theStreamAPI), as the HibernateQueryscrollmethod uses a scrollableResultSetby default, - the fetch size is greater than
0, which you can set per query (e.g., using theorg.hibernate.fetchSizequery hint) or for all statements via thedefaultRowFetchSizeJDBC Driver property, - the query runs in a database transaction, so that the connection has auto-commit disabled.
QueryLimitInMemoryEvent
This event tells you that a paginated JPQL or Criteria API query was executed with the Hibernate 7.4 org.hibernate.limitInMemory query hint, so Hibernate fetches the entire result set from the database and applies the pagination in memory.
Since Hibernate 7.4, the pagination of the queries that fetch collections is applied in SQL, using a derived table, and the org.hibernate.limitInMemory query hint only restores the behavior of the previous versions. You should remove the query hint.
QueryResultIteratorCountEvent
This event is triggered when the Session iterate method returns an Iterator that contains more elements than the maximum query result size, which is given by the hypersistence.query.max_result_size runtime property.
By default, the Query max result size is set to 100 elements. This value can be overridden on a per-query, Persistence Context, or Persistence Unit basis. You can also change the default value using the setQueryMaxResultSize method of the ConfigThresholds builder, as explained in the Thresholds section.
Check out the runtime configuration properties section for more details about how you can customize this property value.
QueryResultListSizeEvent
Fetching a very large List with a JPA or Hibernate Query should be avoided because it impacts both the user experience and consumes database and application resources.
By default, the Query maximum result size is set to 100 elements. This value can be overridden on a per-query, Persistence Context, or Persistence Unit basis. You can also change the default value using the setQueryMaxResultSize method of the ConfigThresholds builder, as explained in the Thresholds section.
Check out the runtime configuration properties section for more details about how you can customize this property value.
QueryResultScrollableCountEvent
This event is triggered when the ScrollableResults returned by the Hibernate Query scroll method, or by the legacy Hibernate Criteria scroll method, fetches more elements than the maximum query result size, which is given by the hypersistence.query.max_result_size runtime property.
The event is triggered as soon as the ScrollableResults fetches more elements than the maximum query result size, so it doesn’t matter whether the application scrolls the entire result set or closes the ScrollableResults before reaching its end. Every navigation method that positions the cursor on a record (e.g., next, scroll, last) counts as a fetched element, so moving the cursor to the last record to count the records fetches a single element.
Scrolling a very large result set is often the sign that the query fetches more data than it needs. If you need to process a large result set, you are better off processing it in batches, using pagination.
By default, the Query maximum result size is set to 100 elements. This value can be overridden on a per-query, Persistence Context, or Persistence Unit basis. Check out the runtime configuration properties section for more details about setting this property. You can also change the default value using the setQueryMaxResultSize method of the ConfigThresholds builder, as explained in the Thresholds section.
QueryResultStreamCountEvent
This event is triggered when the Stream returned by the JPA Query getResultStream method or by the Hibernate Query stream method fetches more elements than the maximum query result size, which is given by the hypersistence.query.max_result_size runtime property. This check is available for Hibernate ORM 5.2 and newer versions.
The event is triggered as soon as the Stream fetches more elements than the maximum query result size, so it doesn’t matter whether the application consumes the entire Stream or closes it earlier. Only the elements the Stream pipeline actually fetches are counted, so a short-circuiting operation (e.g., limit or findFirst) that fetches fewer elements than the maximum query result size doesn’t trigger the event.
Streaming a very large result set is often the sign that the query fetches more data than it needs. If you need to process a large result set, you are better off processing it in batches, using pagination.
By default, the Query maximum result size is set to 100 elements. This value can be overridden on a per-query, Persistence Context, or Persistence Unit basis. Check out the runtime configuration properties section for more details about setting this property. You can also change the default value using the setQueryMaxResultSize method of the ConfigThresholds builder, as explained in the Thresholds section.
QueryTimeoutEvent
Running a query for too long is to be avoided because it impacts user experience, consumes resources, and prevents other concurrent requests from using the acquired resources (e.g., database connections).
By default, the query timeout value is set to 250 milliseconds. The default timeout value can be customized via the hypersistence.query.timeout_millis runtime property. Check out the runtime configuration properties section for more details about setting this property. You can also change the default value using the setQueryTimeoutMillis method of the ConfigThresholds builder, as explained in the Thresholds section.
Release Notes
You can check out the release notes using the following link.
