How to get the SQL execution plan on Oracle
Are you struggling with performance issues in your Spring, Jakarta EE, or Java EE application?
Imagine having a tool that could automatically detect performance issues in your JPA and Hibernate data access layer long before pushing a problematic change into production!
With the widespread adoption of AI agents generating code in a heartbeat, having such a tool that can watch your back and prevent performance issues during development, long before they affect production systems, can save your company a lot of money and make you a hero!
Hypersistence Optimizer is that tool, and it works with Spring Boot, Spring Framework, Jakarta EE, Java EE, Quarkus, Micronaut, or Play Framework.
So, rather than allowing performance issues to annoy your customers, you are better off preventing those issues using Hypersistence Optimizer and enjoying spending your time on the things that you love!
Introduction
In this article, we are going to see how we can get the SQL execution plan on Oracle.
When tuning performance, the execution plan is indispensable as it allows you to understand the operations done by the database when executing a certain SQL query.
What is the SQL execution plan
As I explained in this article, SQL described the What and not the How, and this is one of the major reasons why SQL has been the most popular way to query a database for over 40 years.
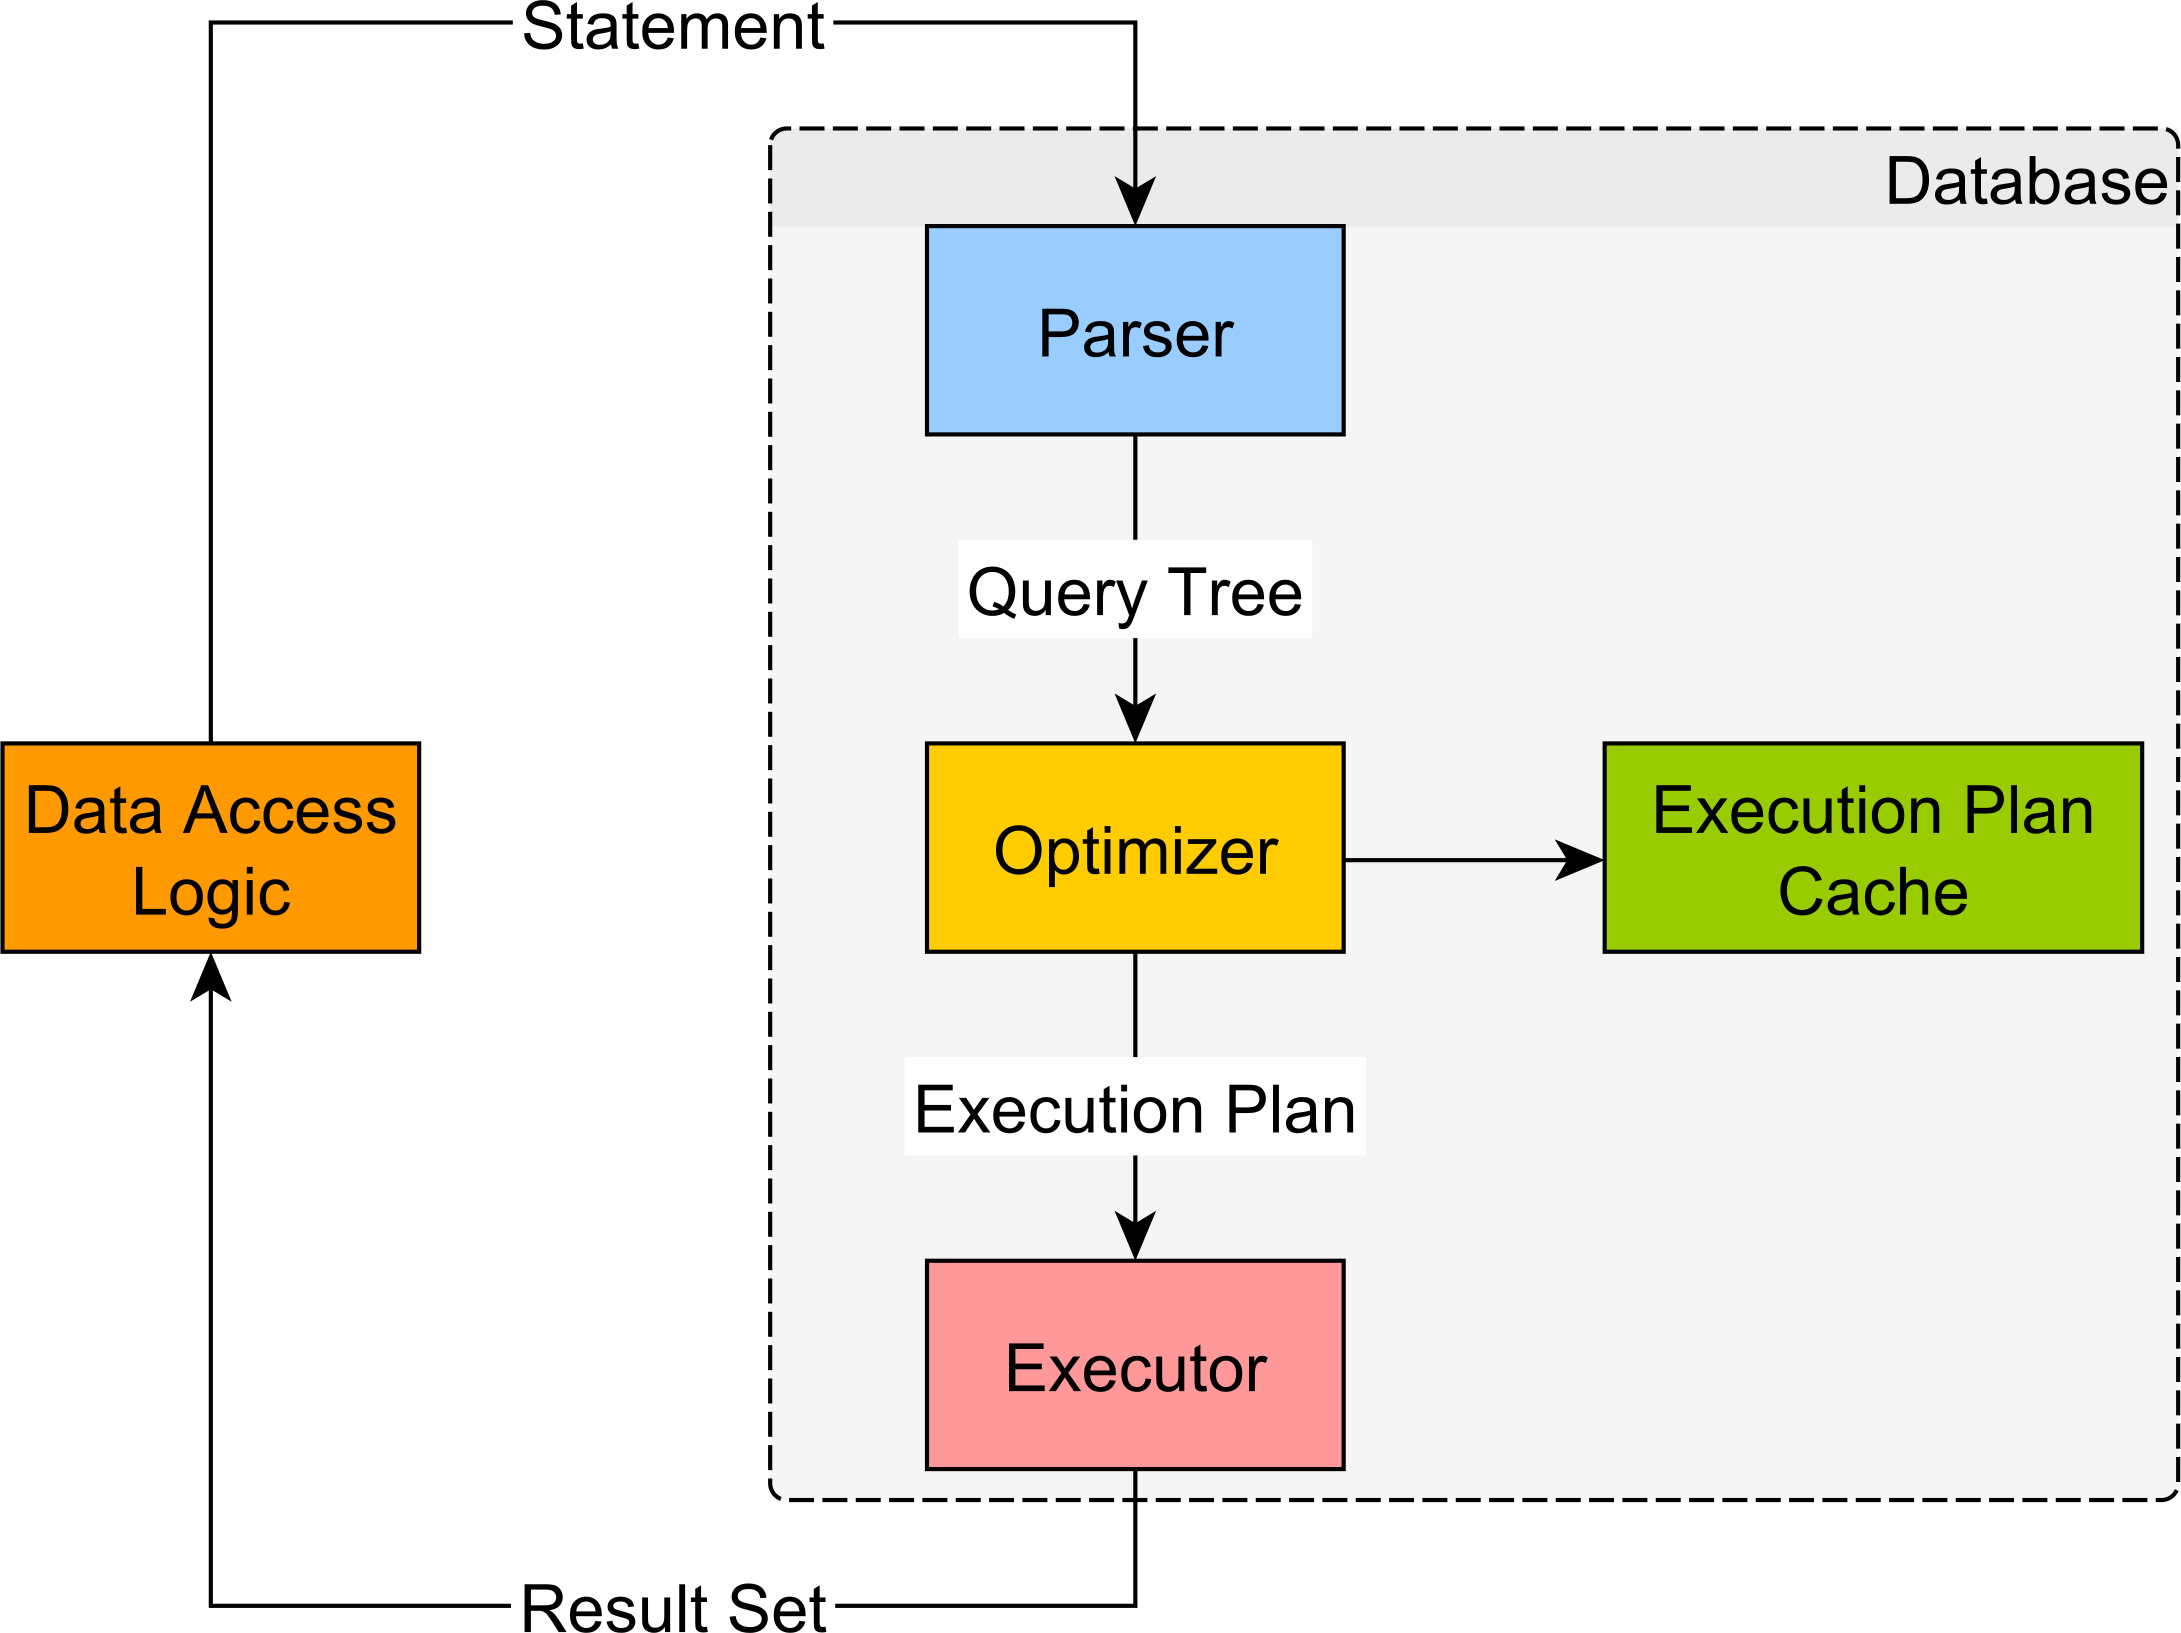
When running a SQL query, the database will first parse it and generate an AST (Abstract Syntax Tree) for the incoming query. The Parser also validates the SQL query syntax and checks whether the referenced database resources exist. The Parser may rewrite the incoming query to optimize its execution without affecting the result set fetching logic.
The generated Query Tree is sent to the Optimizer, which needs to figure out the best way to fetch the data needed by the current SQL query. The Optimizer, therefore, creates an execution plan, which is the list of operations needed to be executed in order to satisfy the SQL query requirements.
The resulting execution plan is sent to the Executor, which runs it and sents the fetched data back to the database client.
The SQL processing and execution steps can be visualized in the following diagram.
The estimated SQL execution plan
The estimated execution plan is generated by the Optimizer without executing the SQL query. You can generate the estimated execution plan from any SQL client using EXPLAIN PLAN FOR or you can use Oracle SQL Developer for this task.
EXPLAIN PLAN FOR
When using Oracle, if you prepend the EXPLAIN PLAN FOR command to a given SQL query, the database will store the estimated execution plan in the associated PLAN_TABLE:
EXPLAIN PLAN FOR
SELECT p.id
FROM post p
WHERE EXISTS (
  SELECT 1
  FROM post_comment pc
  WHERE
    pc.post_id = p.id AND
    pc.review = 'Bingo'
)
ORDER BY p.title
OFFSET 20 ROWS
FETCH NEXT 10 ROWS ONLY
To view the estimated execution plan, you need to use DBMS_XPLAN.DISPLAY, as illustrated in the following example:
SELECT *
FROM TABLE(DBMS_XPLAN.DISPLAY (FORMAT=>'ALL +OUTLINE'))
The
ALL +OUTLINEformatting option allows you to get more details about the estimated execution plan than using the default formatting option.
The estimated plan will look something like this:
Plan hash value: 3657219412

----------------------------------------------------------------------------------------------------------
| Id  | Operation                              | Name            | Rows  | Bytes | Cost (%CPU)| Time     |
----------------------------------------------------------------------------------------------------------
|   0 | SELECT STATEMENT                       |                 |    55 | 29590 |     4  (25)| 00:00:01 |
|*  1 |  VIEW                                  |                 |    55 | 29590 |     4  (25)| 00:00:01 |
|*  2 |   WINDOW SORT PUSHED RANK              |                 |    55 | 57750 |     4  (25)| 00:00:01 |
|   3 |    NESTED LOOPS SEMI                   |                 |    55 | 57750 |     3   (0)| 00:00:01 |
|   4 |     TABLE ACCESS FULL                  | POST            |   500 |   256K|     3   (0)| 00:00:01 |
|*  5 |     TABLE ACCESS BY INDEX ROWID BATCHED| POST_COMMENT    |     6 |  3150 |     0   (0)| 00:00:01 |
|*  6 |      INDEX RANGE SCAN                  | POST_REVIEW_IDX |    55 |       |     0   (0)| 00:00:01 |
----------------------------------------------------------------------------------------------------------

Query Block Name / Object Alias (identified by operation id):
-------------------------------------------------------------

   1 - SEL$5DA710D3 / from$_subquery$_003@SEL$3
   2 - SEL$5DA710D3
   4 - SEL$5DA710D3 / P@SEL$1
   5 - SEL$5DA710D3 / PC@SEL$2
   6 - SEL$5DA710D3 / PC@SEL$2

Outline Data
-------------

  /*+
      BEGIN_OUTLINE_DATA
      USE_NL(@"SEL$5DA710D3" "PC"@"SEL$2")
      LEADING(@"SEL$5DA710D3" "P"@"SEL$1" "PC"@"SEL$2")
      BATCH_TABLE_ACCESS_BY_ROWID(@"SEL$5DA710D3" "PC"@"SEL$2")
      INDEX_RS_ASC(@"SEL$5DA710D3" "PC"@"SEL$2" ("POST_COMMENT"."REVIEW"))
      FULL(@"SEL$5DA710D3" "P"@"SEL$1")
      NO_ACCESS(@"SEL$3" "from$_subquery$_003"@"SEL$3")
      OUTLINE(@"SEL$2")
      OUTLINE(@"SEL$1")
      OUTLINE_LEAF(@"SEL$3")
      UNNEST(@"SEL$2")
      OUTLINE_LEAF(@"SEL$5DA710D3")
      ALL_ROWS
      DB_VERSION('18.1.0')
      OPTIMIZER_FEATURES_ENABLE('18.1.0')
      IGNORE_OPTIM_EMBEDDED_HINTS
      END_OUTLINE_DATA
  */

Predicate Information (identified by operation id):
---------------------------------------------------

   1 - filter("from$_subquery$_003"."rowlimit_$$_rownumber"<=CASE  WHEN (20>=0) THEN 20 ELSE 0
              END +10 AND "from$_subquery$_003"."rowlimit_$$_rownumber">20)
   2 - filter(ROW_NUMBER() OVER ( ORDER BY "P"."TITLE")<=CASE  WHEN (20>=0) THEN 20 ELSE 0 END
              +10)
   5 - filter("PC"."POST_ID"="P"."ID")
   6 - access("PC"."REVIEW"='Bingo')

Column Projection Information (identified by operation id):
-----------------------------------------------------------

   1 - (rowset=60) "from$_subquery$_003"."ID"[NUMBER,22],
       "from$_subquery$_003"."rowlimit_$$_rownumber"[NUMBER,22]
   2 - (#keys=1; rowset=60) "P"."TITLE"[VARCHAR2,1020], "P"."ID"[NUMBER,22], ROW_NUMBER() OVER (
       ORDER BY "P"."TITLE")[22]
   3 - (#keys=0) "P"."ID"[NUMBER,22], "P"."TITLE"[VARCHAR2,1020]
   4 - "P"."ID"[NUMBER,22], "P"."TITLE"[VARCHAR2,1020]
   6 - "PC".ROWID[ROWID,10]
Note that some columns were removed to
Oracle SQL Developer
If you have installed SQL Developer, you can easily get the estimated execution plan for any SQL query without having to prepend the EXPLAIN PLAN FOR command:

The actual SQL execution plan
The actual SQL execution plan is generated by the Optimizer when running the SQL query. So, unlike the estimated Execution Plan, you need to execute the SQL query in order to get its actual execution plan.
The actual plan should not differ significantly from the estimated one, as long as the table statistics have been properly collected by the underlying relational database.
GATHER_PLAN_STATISTICS query hint
To get the actual execution plan for a given SQL query, one option is to use the GATHER_PLAN_STATISTICS query hint on the query we want to analyze:
SELECT /*+ GATHER_PLAN_STATISTICS */
  p.id
FROM post p
WHERE EXISTS (
  SELECT 1
  FROM post_comment pc
  WHERE
    pc.post_id = p.id AND
    pc.review = 'Bingo'
)
ORDER BY p.title
OFFSET 20 ROWS
FETCH NEXT 10 ROWS ONLY
Afterward, to visualize the actual execution plan, we need to query the DBMS_XPLAN.DISPLAY_CURSOR:
SELECT *
FROM TABLE(DBMS_XPLAN.DISPLAY_CURSOR(FORMAT=>'ALLSTATS LAST ALL +OUTLINE'))
And the actual plan will look like this:
Plan hash value: 3657219412

-------------------------------------------------------------------------------------------------------------------------------------------------------------------------------
| Id  | Operation                              | Name            | Starts | E-Rows |E-Bytes| Cost (%CPU)| E-Time   | A-Rows |   A-Time   | Buffers |  OMem |  1Mem | Used-Mem |
-------------------------------------------------------------------------------------------------------------------------------------------------------------------------------
|   0 | SELECT STATEMENT                       |                 |      1 |        |       |     4 (100)|          |     10 |00:00:00.01 |    1390 |       |       |          |
|*  1 |  VIEW                                  |                 |      1 |     73 | 39274 |     4  (25)| 00:00:01 |     10 |00:00:00.01 |    1390 |       |       |          |
|*  2 |   WINDOW SORT PUSHED RANK              |                 |      1 |     73 | 76650 |     4  (25)| 00:00:01 |     30 |00:00:00.01 |    1390 |  4096 |  4096 | 4096  (0)|
|   3 |    NESTED LOOPS SEMI                   |                 |      1 |     73 | 76650 |     3   (0)| 00:00:01 |     73 |00:00:00.01 |    1390 |       |       |          |
|   4 |     TABLE ACCESS FULL                  | POST            |      1 |    500 |   256K|     3   (0)| 00:00:01 |    500 |00:00:00.01 |       7 |       |       |          |
|*  5 |     TABLE ACCESS BY INDEX ROWID BATCHED| POST_COMMENT    |    500 |     11 |  5775 |     0   (0)|          |     73 |00:00:00.01 |    1383 |       |       |          |
|*  6 |      INDEX RANGE SCAN                  | POST_REVIEW_IDX |    500 |     73 |       |     0   (0)|          |  33872 |00:00:00.01 |       8 |       |       |          |
-------------------------------------------------------------------------------------------------------------------------------------------------------------------------------

Query Block Name / Object Alias (identified by operation id):
-------------------------------------------------------------

   1 - SEL$5DA710D3 / from$_subquery$_003@SEL$3
   2 - SEL$5DA710D3
   4 - SEL$5DA710D3 / P@SEL$1
   5 - SEL$5DA710D3 / PC@SEL$2
   6 - SEL$5DA710D3 / PC@SEL$2

Outline Data
-------------

  /*+
      BEGIN_OUTLINE_DATA
      IGNORE_OPTIM_EMBEDDED_HINTS
      OPTIMIZER_FEATURES_ENABLE('18.1.0')
      DB_VERSION('18.1.0')
      ALL_ROWS
      OUTLINE_LEAF(@"SEL$5DA710D3")
      UNNEST(@"SEL$2")
      OUTLINE_LEAF(@"SEL$3")
      OUTLINE(@"SEL$1")
      OUTLINE(@"SEL$2")
      NO_ACCESS(@"SEL$3" "from$_subquery$_003"@"SEL$3")
      FULL(@"SEL$5DA710D3" "P"@"SEL$1")
      INDEX_RS_ASC(@"SEL$5DA710D3" "PC"@"SEL$2" ("POST_COMMENT"."REVIEW"))
      BATCH_TABLE_ACCESS_BY_ROWID(@"SEL$5DA710D3" "PC"@"SEL$2")
      LEADING(@"SEL$5DA710D3" "P"@"SEL$1" "PC"@"SEL$2")
      USE_NL(@"SEL$5DA710D3" "PC"@"SEL$2")
      END_OUTLINE_DATA
  */

Predicate Information (identified by operation id):
---------------------------------------------------

   1 - filter(("from$_subquery$_003"."rowlimit_$$_rownumber"<=CASE  WHEN (20>=0) THEN 20 ELSE 0 END +10 AND "from$_subquery$_003"."rowlimit_$$_rownumber">20))
   2 - filter(ROW_NUMBER() OVER ( ORDER BY "P"."TITLE")<=CASE  WHEN (20>=0) THEN 20 ELSE 0 END +10)
   5 - filter("PC"."POST_ID"="P"."ID")
   6 - access("PC"."REVIEW"='Bingo')

Column Projection Information (identified by operation id):
-----------------------------------------------------------

   1 - (rowset=60) "from$_subquery$_003"."ID"[NUMBER,22], "from$_subquery$_003"."rowlimit_$$_rownumber"[NUMBER,22]
   2 - (#keys=1; rowset=60) "P"."TITLE"[VARCHAR2,1020], "P"."ID"[NUMBER,22], ROW_NUMBER() OVER ( ORDER BY "P"."TITLE")[22]
   3 - "P"."ID"[NUMBER,22], "P"."TITLE"[VARCHAR2,1020]
   4 - "P"."ID"[NUMBER,22], "P"."TITLE"[VARCHAR2,1020]
   6 - "PC".ROWID[ROWID,10]
You can also use the
GATHER_PLAN_STATISTICSquery hint to inspect the SQL execution plan associated with a given JPQL or Criteria API query.For more details about this topic, check out this article.
Enable STATISTICS at the DB connection level
If you want to get the execution plans for all queries generated within a given session, you can set the STATISTICS_LEVEL session setting to ALL:
ALTER SESSION SET STATISTICS_LEVEL='ALL'
This will have the same effect as setting the GATHER_PLAN_STATISTICS query hint on every execution query. So, just like with the GATHER_PLAN_STATISTICS query hint, you can use DBMS_XPLAN.DISPLAY_CURSOR to view the actual execution plan.
You should reset the STATISTICS_LEVEL setting to the default mode once you are done collecting the execution plans you were interested in. This is very important, especially if you are using connection pooling, and database connections get reused.
ALTER SESSION SET STATISTICS_LEVEL='TYPICAL'
If you enjoyed this article, I bet you are going to love my Book and Video Courses as well.


Conclusion
Knowing the difference between the estimated and the actual SQL execution plan is very important when using a relational database system.
If you want to speed up a certain SQL query, you need to inspect the execution plan to determine what exactly is causing the query to run slowly. Without the SQL execution plan, it’s not possible to tell what the database might be doing under the hood when executing a given SQL query.