How to get the actual execution plan for an Oracle SQL query using Hibernate query hints
Are you struggling with performance issues in your Spring, Jakarta EE, or Java EE application?
Imagine having a tool that could automatically detect performance issues in your JPA and Hibernate data access layer long before pushing a problematic change into production!
With the widespread adoption of AI agents generating code in a heartbeat, having such a tool that can watch your back and prevent performance issues during development, long before they affect production systems, can save your company a lot of money and make you a hero!
Hypersistence Optimizer is that tool, and it works with Spring Boot, Spring Framework, Jakarta EE, Java EE, Quarkus, Micronaut, or Play Framework.
So, rather than allowing performance issues to annoy your customers, you are better off preventing those issues using Hypersistence Optimizer and enjoying spending your time on the things that you love!
Introduction
While answering this question on the Hibernate forum, I realized that it’s a good idea to write an article about getting the actual execution plan for an Oracle SQL query using Hibernate query hints feature.
SQL statement execution
A SQL statement only defines what needs to be selected and not how data is going to be queried. It is the database’s responsibility to turn an SQL statement into an execution plan that is both effective and efficient.
To visualize how an SQL statement is executed by a relational database system, consider the following diagram:
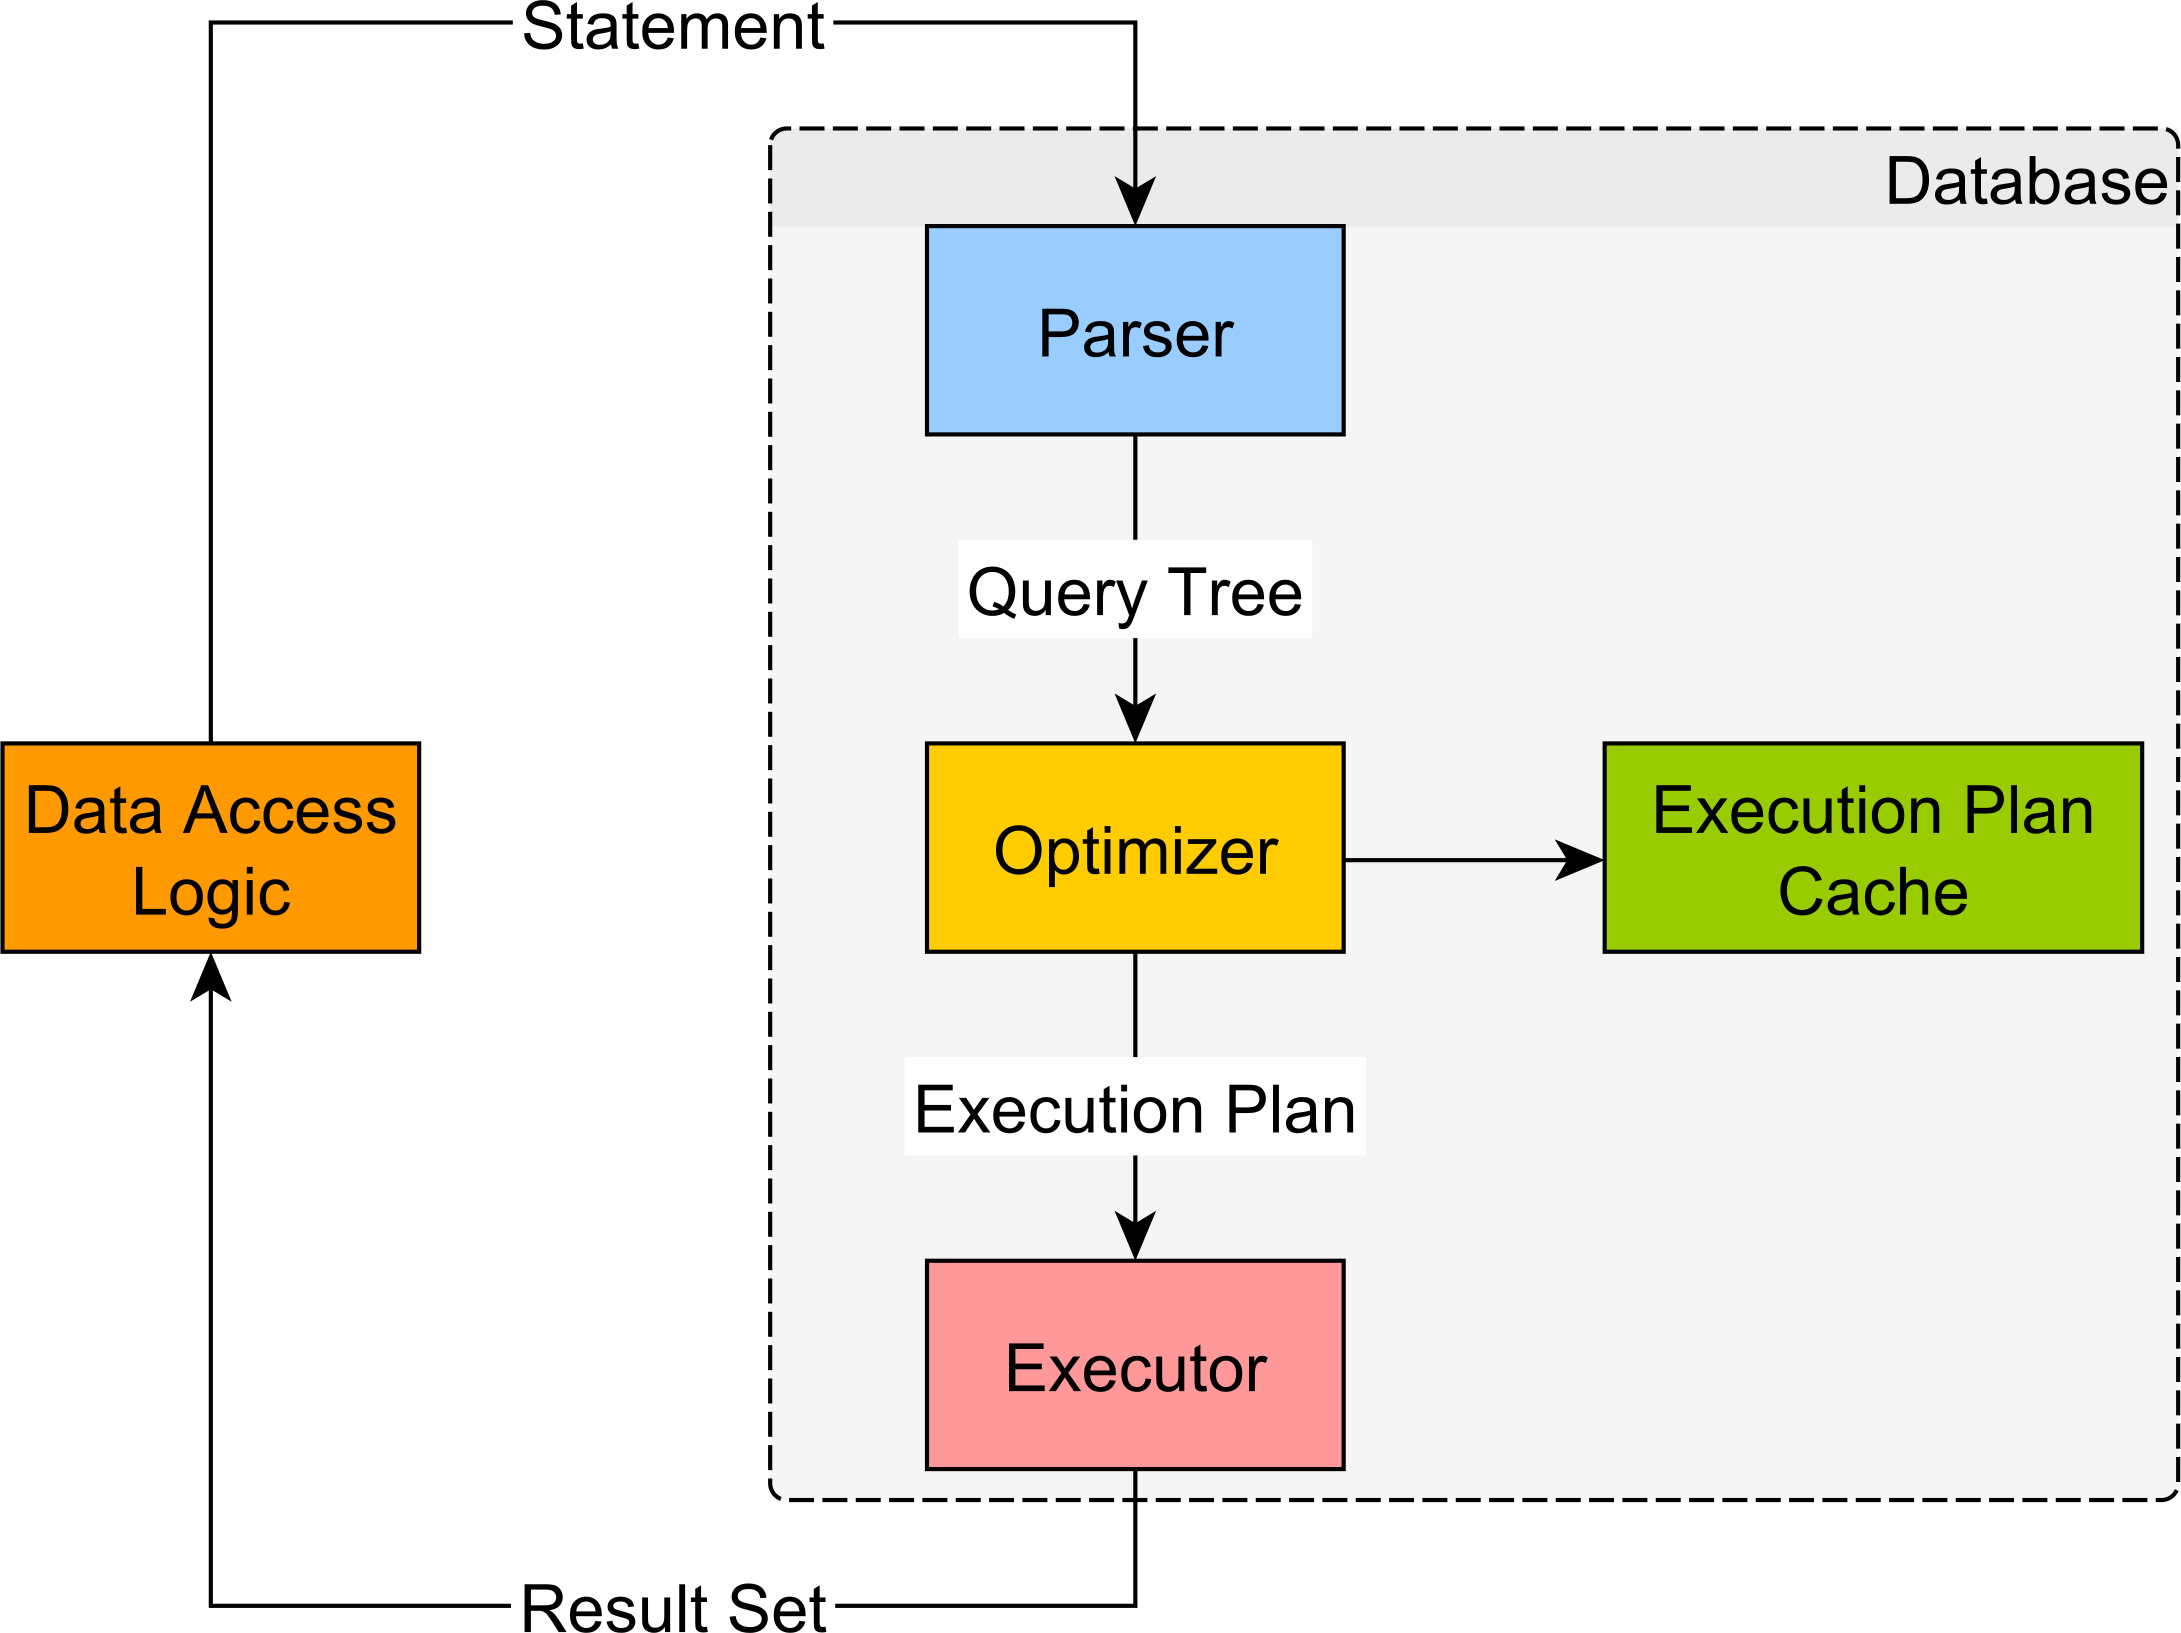
First, the statement is parsed, and a Query Tree is generated. While parsing the String-based SQL statement, the database validates the statement structure and rejects it if the SQL query is malformed.
The Query Tree is then used to build an Execution Plan, which is the algorithm used to fetch data. The database component which chooses the optimal Execution Plan is called CBO (Cost-Based Optimizer).
The relational database CBO can choose from different joining types (e.g., Nested Loops Joins, Hash Joins, Merge Joins), the table join order, what indexes to use or whether a sequential scan is more appropriate. The decision is based on the cost (CPU, IO, memory) of each particular operation that is included in the Execution Plan. In the end, the database will choose the Execution Plan with the lowest cost.
After the Execution Plan is generated, it will be used by the Executor to extract data and send it to the client.
Actual Execution Plan
Many relational database systems offer the EXPLAIN SQL command so that you can get the Execution Plan for a given SQL query. However, this plan is what the database thinks it is optimal and it might be different from the actual Execution Plan used in the end.
If the table data statistics is outdated or the plan was cached for a different set of bind parameter values, it could be that the actual execution plan is different than the one outputted by the EXPLAIN command.
For Oracle, we can use the DBMS_XPLAN package to display the execution plan of a given SQL query.
Lukas Eder provides a very good article about fetching the execution plan for a given SQL statement.
Basically, we need to:
- Use the
GATHER_PLAN_STATISTICSOracle SQL query hint when executing the statement whose plan we are interested in visualizing. - We can use the
v$sqlstatistics table to locate our query.
Testing time
Assuming we have the following SQL query:
List<Long> postIds = entityManager.createNativeQuery("""
    SELECT
         p.id
    FROM
         post p
    WHERE EXISTS (
        SELECT 1
        FROM
            post_comment pc
        WHERE
            pc.post_id = p.id AND
            pc.review = 'Bingo'
    )
    ORDER BY
         p.title
    """)
.setFirstResult(pageStart)
.setMaxResults(pageSize)
.getResultList();
We want to check what execution plan was chosen by Oracle when executing this query.
For this reason, we need to provide the following query hints using the Hibernate org.hibernate.query.Query setQueryHint method:
List<Long> postIds = entityManager.createNativeQuery("""
    SELECT
         p.id
    FROM
         post p
    WHERE EXISTS (
        SELECT 1
        FROM
            post_comment pc
        WHERE
            pc.post_id = p.id AND
            pc.review = 'Bingo'
    )
    ORDER BY
         p.title
    """)
.setFirstResult(pageStart)
.setMaxResults(pageSize)
.addQueryHint("GATHER_PLAN_STATISTICS")
.addQueryHint("POST_WITH_BINGO_COMMENTS")
.getResultList();
The GATHER_PLAN_STATISTICS query hint is for getting the number of estimated and the actual rows for each row source, while the POST_WITH_BINGO_COMMENTS is a custom hint we used to locate the plan for this particular SQL query.
To get the execution plan, we need to run the following SQL query:
List<String> executionPlanLines = entityManager.createNativeQuery("""
    SELECT p.*
    FROM
        v$sql s,
        TABLE (
            dbms_xplan.display_cursor (
                s.sql_id, s.child_number, 'ALLSTATS LAST'
            )
        ) p
    WHERE s.sql_text LIKE '%POST_WITH_BINGO_COMMENTS%'
    """)
.getResultList();

LOGGER.info(
    "Execution plan: \n{}",
    executionPlanLines
    .stream()
    .collect(
        Collectors.joining("\n")
    )
);
And we will get the actual execution plan:
SQL_ID  cxktfd882hu65, child number 0
-------------------------------------
select /*+ GATHER_PLAN_STATISTICS, POST_WITH_BINGO_COMMENTS */ * from
( select row_.*, rownum rownum_ from ( SELECT      p.id FROM      post
p WHERE EXISTS (      SELECT 1      FROM           post_comment pc
WHERE           pc.post_id = p.id AND           pc.review = 'Bingo' )
ORDER BY      p.title ) row_ where rownum <= :1 ) where rownum_ > :2

Plan hash value: 284760697

-----------------------------------------------------------------------------------------------------------------
| Id  | Operation                | Name         | Starts | E-Rows | A-Rows | Buffers |  OMem |  1Mem | Used-Mem |
-----------------------------------------------------------------------------------------------------------------
|   0 | SELECT STATEMENT         |              |      1 |        |     10 |      14 |       |       |          |
|*  1 |  VIEW                    |              |      1 |     30 |     10 |      14 |       |       |          |
|*  2 |   COUNT STOPKEY          |              |      1 |        |     30 |      14 |       |       |          |
|   3 |    VIEW                  |              |      1 |     62 |     30 |      14 |       |       |          |
|*  4 |     SORT ORDER BY STOPKEY|              |      1 |     62 |     30 |      14 | 73728 | 73728 |          |
|*  5 |      HASH JOIN RIGHT SEMI|              |      1 |     62 |     62 |      14 |  1452K|  1452K| 1287K (0)|
|*  6 |       TABLE ACCESS FULL  | POST_COMMENT |      1 |     62 |     62 |       7 |       |       |          |
|   7 |       TABLE ACCESS FULL  | POST         |      1 |    500 |    500 |       7 |       |       |          |
-----------------------------------------------------------------------------------------------------------------

Predicate Information (identified by operation id):
---------------------------------------------------

   1 - filter("ROWNUM_">:2)
   2 - filter(ROWNUM<=:1)
   4 - filter(ROWNUM<=:1)
   5 - access("PC"."POST_ID"="P"."ID")
   6 - filter("PC"."REVIEW"='Bingo')

Note
-----
   - dynamic sampling used for this statement (level=2)
Cool, right?
Using a query hint and a comment
Another option is to use a query hint to pass the GATHER_PLAN_STATISTICS Oracle hint while using an SQL comment for our POST_WITH_BINGO_COMMENTS SQL identification comment:
List<Long> summaries = entityManager.createNativeQuery("""
    SELECT
         p.id
    FROM
         post p
    WHERE EXISTS (
         SELECT 1
         FROM
              post_comment pc
         WHERE
              pc.post_id = p.id AND
              pc.review = 'Bingo'
    )
    ORDER BY
         p.title
    """)
.setFirstResult(pageStart)
.setMaxResults(pageSize)
.unwrap(org.hibernate.query.Query.class)
.addQueryHint("GATHER_PLAN_STATISTICS")
.setComment("POST_WITH_BINGO_COMMENTS")
.getResultList();

LOGGER.info(
    "Execution plan: \n{}",
    executionPlanLines
    .stream()
    .collect(
        Collectors.joining("\n")
    )
);
For this to work, we need to activate SQL-level comments with the following Hibernate configuration property:
<property name="hibernate.use_sql_comments" value="true"/>
Now, Hibernate is going to generate the following SQL statement:
/* POST_WITH_BINGO_COMMENTS */
SELECT /*+ GATHER_PLAN_STATISTICS */ *
FROM
  (SELECT row_.*, rownum rownum_
   FROM
     (SELECT p.id
      FROM post p
      WHERE EXISTS
          (SELECT 1
           FROM post_comment pc
           WHERE pc.post_id = p.id
             AND pc.review = 'Bingo' )
      ORDER BY p.title) row_
   WHERE rownum <= 30)
WHERE rownum_ > 20
And the Execution Plan is going to be fetched just fine:
SQL_ID  75yys0009b8fa, child number 0
-------------------------------------
/* POST_WITH_BINGO_COMMENTS */ select /*+ GATHER_PLAN_STATISTICS */ *
from ( select row_.*, rownum rownum_ from ( SELECT      p.id FROM
post p WHERE EXISTS (      SELECT 1      FROM           post_comment pc
     WHERE           pc.post_id = p.id AND           pc.review =
'Bingo' ) ORDER BY      p.title ) row_ where rownum <= :1 ) where
rownum_ > :2

Plan hash value: 284760697

------------------------------------------------------------------------------------------------------------------------------
| Id  | Operation                | Name         | Starts | E-Rows | A-Rows |   A-Time   | Buffers |  OMem |  1Mem | Used-Mem |
------------------------------------------------------------------------------------------------------------------------------
|   0 | SELECT STATEMENT         |              |      1 |        |     10 |00:00:00.01 |      14 |       |       |          |
|*  1 |  VIEW                    |              |      1 |     30 |     10 |00:00:00.01 |      14 |       |       |          |
|*  2 |   COUNT STOPKEY          |              |      1 |        |     30 |00:00:00.01 |      14 |       |       |          |
|   3 |    VIEW                  |              |      1 |     52 |     30 |00:00:00.01 |      14 |       |       |          |
|*  4 |     SORT ORDER BY STOPKEY|              |      1 |     52 |     30 |00:00:00.01 |      14 | 73728 | 73728 |          |
|*  5 |      HASH JOIN RIGHT SEMI|              |      1 |     52 |     52 |00:00:00.01 |      14 |  1452K|  1452K| 1237K (0)|
|*  6 |       TABLE ACCESS FULL  | POST_COMMENT |      1 |     52 |     52 |00:00:00.01 |       7 |       |       |          |
|   7 |       TABLE ACCESS FULL  | POST         |      1 |    500 |    500 |00:00:00.01 |       7 |       |       |          |
------------------------------------------------------------------------------------------------------------------------------

Predicate Information (identified by operation id):
---------------------------------------------------

   1 - filter(ROWNUM_>:2)
   2 - filter(ROWNUM<=:1)
   4 - filter(ROWNUM<=:1)
   5 - access(PC.POST_ID=P.ID)
   6 - filter(PC.REVIEW='Bingo')

Note
-----
   - dynamic sampling used for this statement (level=2)
If you enjoyed this article, I bet you are going to love my Book and Video Courses as well.


Conclusion
When tuning SQL queries, it is very important to inspect the execution plan and understand what is done by the relational database in order to execute a certain SQL statement.
The Hibernate query hint feature proves very handy when retrieving the Oracle execution plan, and it works the same for both native SQL and JPQL queries.