Spring Boot performance monitoring
Are you struggling with performance issues in your Spring, Jakarta EE, or Java EE application?
Imagine having a tool that could automatically detect performance issues in your JPA and Hibernate data access layer long before pushing a problematic change into production!
With the widespread adoption of AI agents generating code in a heartbeat, having such a tool that can watch your back and prevent performance issues during development, long before they affect production systems, can save your company a lot of money and make you a hero!
Hypersistence Optimizer is that tool, and it works with Spring Boot, Spring Framework, Jakarta EE, Java EE, Quarkus, Micronaut, or Play Framework.
So, rather than allowing performance issues to annoy your customers, you are better off preventing those issues using Hypersistence Optimizer and enjoying spending your time on the things that you love!
Introduction
To ensure that your Spring Boot application fulfills the SLA (Service Level Agreement) requirements, you need a performance monitoring tool.
In this article, I’m going to show you how you can monitor the data access layer of a Spring Boot application using Hypersistence Optimizer.
Domain Model
Let’s assume we have an application that uses the following Store and StoreDetails entities:
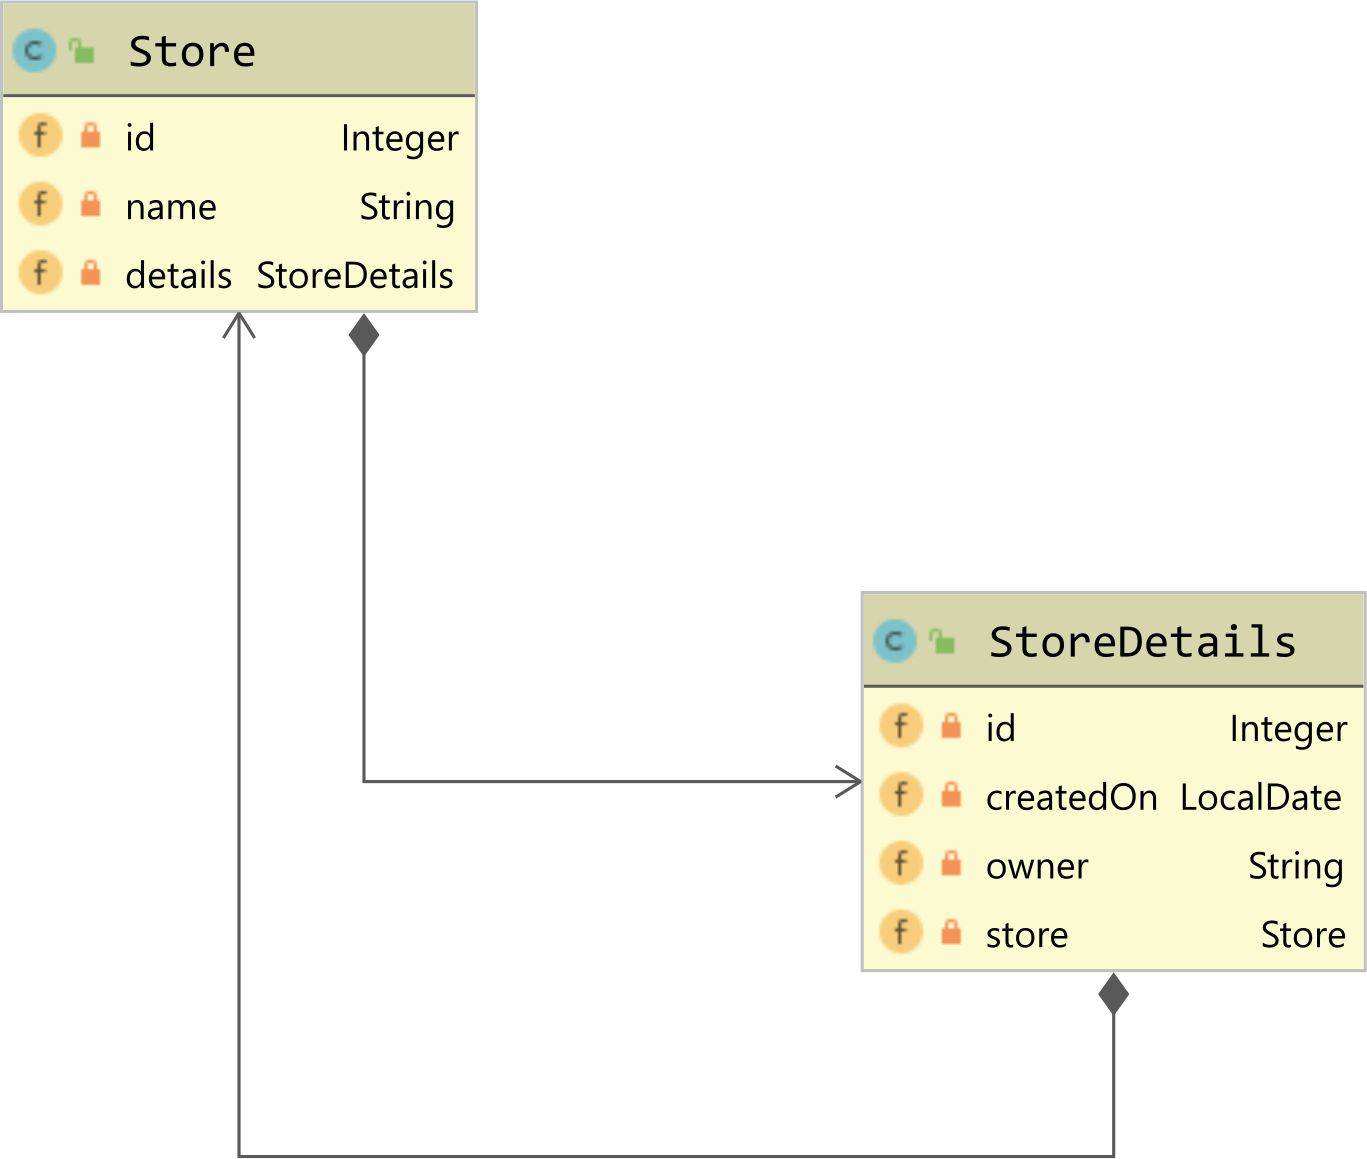
The Store entity is mapped to the store table like this:
@Entity
@Table(name = "stores")
public class Store {

    @Id
    private Integer id;

    private String name;

    @OneToOne(
        mappedBy = "store",
        cascade = CascadeType.ALL,
        optional = true
    )
    private StoreDetails details;

    public Integer getId() {
        return id;
    }

    public Store setId(Integer id) {
        this.id = id;
        return this;
    }

    public String getName() {
        return name;
    }

    public Store setName(String name) {
        this.name = name;
        return this;
    }

    public StoreDetails getDetails() {
        return details;
    }

    public Store setDetails(StoreDetails details) {
        this.details = details;
        details.setStore(this);
        return this;
    }
}
Notice that the property setter methods use the Fluent-style API to simplify the entity building process.
Because the details property maps a bidirectional @OneToOne association, the setDetails method synchronizes both sides of the association. For more details about why JPA and Hibernate require synchronizing both sides of a bidirectional association, check out this article.
The StoreDetails child entity is mapped like this:
@Entity
@Table(name = "store_details")
public class StoreDetails {

    @Id
    private Integer id;

    @Column(name = "created_on")
    private LocalDate createdOn = LocalDate.now();

    private String owner;

    @OneToOne
    @MapsId
    @JoinColumn(name = "id")
    private Store store;

    public Integer getId() {
        return id;
    }

    public StoreDetails setId(Integer id) {
        this.id = id;
        return this;
    }

    public LocalDate getCreatedOn() {
        return createdOn;
    }

    public StoreDetails setCreatedOn(LocalDate createdOn) {
        this.createdOn = createdOn;
        return this;
    }

    public String getOwner() {
        return owner;
    }

    public StoreDetails setOwner(String owner) {
        this.owner = owner;
        return this;
    }

    public Store getStore() {
        return store;
    }

    public void setStore(Store store) {
        this.store = store;
    }
}
Note that the @OneToOne mapping uses the @MapsId annotation, as otherwise, the table relationship wouldn’t be one-to-one, but one-to-many.
Spring Boot Repository Layer
The StoreRepository interface extends the Spring Data JpaRepository and our own CustomStoreRepository interface, like this:
public interface StoreRepository
    extends JpaRepository<Store, Integer>, CustomStoreRepository {

}
The CustomStoreRepository defines an insertAll method:
public interface CustomStoreRepository {

    void insertAll(Iterable<Store> stores);
}
The insertAll method implementation is done in the CustomStoreRepositoryImpl class:
@Repository
public class CustomStoreRepositoryImpl
        implements CustomStoreRepository {

    @PersistenceContext
    private EntityManager entityManager;

    @Override
    @Transactional
    public void insertAll(Iterable<Store> stores) {
        Session session = entityManager.unwrap(Session.class);
        session.setJdbcBatchSize(100);

        for (Store store : stores) {
            entityManager.persist(store);
        }
    }
}
The insertAll method sets the JDBC batch size to 100 and then calls the persist method of the EntityManager for each Store entity that was provided.
Spring Boot Service Layer
The service layer contains the StoreService interface:
public interface StoreService {

    List<Store> findAll();

    void saveAll(Iterable<Store> entities);

    void insertAll(Iterable<Store> entities);
}
And the StoreServiceImpl class:
@Service
@Transactional(readOnly = true)
public class StoreServiceImpl implements StoreService {

    @Autowired
    private StoreRepository storeRepository;

    @Override
    public List<Store> findAll() {
        return storeRepository.findAll();
    }

    @Override
    @Transactional
    public void saveAll(Iterable<Store> stores) {
        storeRepository.saveAll(stores);
    }

    @Override
    @Transactional
    public void insertAll(Iterable<Store> stores) {
        storeRepository.insertAll(stores);
    }
}
Note that, by default, the service methods use a read-only transactional context to benefit from the read-only Hibernate optimization. The methods that need to insert, update, or delete records need to use a read-write transaction instead.
Configuring Spring Boot to use Hypersistence Optimizer
For performance monitoring, we are going to use Hypersistence Optimizer, which can be configured as follows:
@Configuration
public class HypersistenceConfiguration {

    @Bean
    public HypersistenceOptimizer hypersistenceOptimizer(
            EntityManagerFactory entityManagerFactory) {
        return new HypersistenceOptimizer(
            new JpaConfig(
                entityManagerFactory
            )
            .setProperties(
                Map.of(
                    Config.Property.Session.TIMEOUT_MILLIS, 1000,
                    Config.Property.Session.FLUSH_TIMEOUT_MILLIS, 500
                )
            )
        );
    }
}
The TIMEOUT_MILLIS property instructs that the Persistence Context should not take longer than 1000 milliseconds, and the FLUSH_TIMEOUT_MILLIS property defines a maximum allowed threshold of 500 milliseconds for flushing the Persistence Context.
Spring Boot performance monitoring when saving 500 entities
To validate that the SLA requirements are met, we are going to execute a test case method that inserts a given number of Store and StoreDetails entities:
private List<Store> newStores(int storeCount) {
    List<Store> stores = new ArrayList<>();

    for (int i = 1; i <= storeCount; i++) {
        stores.add(
            new Store()
                .setId(i)
                .setName(String.format("Store no %d", i))
                .setDetails(
                    new StoreDetails()
                        .setId(i)
                        .setOwner("Vlad Mihalcea")
                )
        );
    }

    return stores;
}
Now, when creating 500 Stores and StoreDetails:
hypersistenceOptimizer.getEvents().clear();

storeService.saveAll(newStores(500));

assertTrue(hypersistenceOptimizer.getEvents().isEmpty());
Hypersistence Optimizer notifies us that the Persistence Context has been running for more than a second:
Hypersistence Optimizer: CRITICAL - SessionTimeoutEvent -

The JPA EntityManager or Hibernate Session has run for [1230] ms.
You should avoid long-running Persistence Contexts as they can impact
both the user experience and resource usage.

For more info about this event, check out this User Guide link
-> https://vladmihalcea.com/hypersistence-optimizer/docs/user-guide/#SessionTimeoutEvent
When inspecting the application log, we can see that the following SQL statements have been executed:
select store0_.id as id1_4_1_,
       store0_.name as name2_4_1_,
       storedetai1_.id as id1_3_0_,
       storedetai1_.created_on as created_2_3_0_,
       storedetai1_.owner as owner3_3_0_
from stores store0_
left outer join store_details storedetai1_ on store0_.id=storedetai1_.id
where store0_.id=?

select storedetai0_.id as id1_3_0_,
       storedetai0_.created_on as created_2_3_0_,
       storedetai0_.owner as owner3_3_0_
from store_details storedetai0_
where storedetai0_.id=?

-- 497 pairs of SQL queries deleted for brevity

select store0_.id as id1_4_1_,
       store0_.name as name2_4_1_,
       storedetai1_.id as id1_3_0_,
       storedetai1_.created_on as created_2_3_0_,
       storedetai1_.owner as owner3_3_0_
from stores store0_
left outer join store_details storedetai1_ on store0_.id=storedetai1_.id
where store0_.id=?

select storedetai0_.id as id1_3_0_,
       storedetai0_.created_on as created_2_3_0_,
       storedetai0_.owner as owner3_3_0_
from store_details storedetai0_
where storedetai0_.id=?

insert into stores (name, id) values (?, ?)
insert into store_details (created_on, owner, id) values (?, ?, ?)

insert into stores (name, id) values (?, ?)
insert into store_details (created_on, owner, id) values (?, ?, ?)

-- 497 pairs of SQL queries deleted for brevity

insert into stores (name, id) values (?, ?)
insert into store_details (created_on, owner, id) values (?, ?, ?)
As explained in this article, the SELECT queries are executed because the saveAll method of the JpaRepository uses merge instead of persist when the entity uses an assigned identifier.
Also, no JDBC batching is used, hence this method took more than a second to run.
Spring Boot performance monitoring – optimization results
First of all, we are going to add the following configuration properties:
spring.jpa.properties.hibernate.jdbc.batch_size=5
spring.jpa.properties.hibernate.order_inserts=true
spring.jpa.properties.hibernate.order_updates=true
As explained in this article, we need to set both a JDBC batch size and enable the INSERT and UPDATE statement ordering in order to get the most out of the automatic batching mechanism employed by Hibernate.
Now, instead of using the default saveAll method of the JpaRepository, we will use the insertAll method that we defined in the CustomStoreRepository:
hypersistenceOptimizer.getEvents().clear();

storeService.saveAll(newStores(500));

assertTrue(hypersistenceOptimizer.getEvents().isEmpty());
And, the test passes since no event is generated by Hypersistence Optimizer.
If we check the application log, we can see that batching is indeed used:
insert into stores (name, id) values (?, ?)

o.h.e.jdbc.batch.internal.BatchingBatch  : Executing batch size: 100
o.h.e.jdbc.batch.internal.BatchingBatch  : Executing batch size: 100
o.h.e.jdbc.batch.internal.BatchingBatch  : Executing batch size: 100
o.h.e.jdbc.batch.internal.BatchingBatch  : Executing batch size: 100
o.h.e.jdbc.batch.internal.BatchingBatch  : Executing batch size: 100

insert into store_details (created_on, owner, id) values (?, ?, ?)

o.h.e.jdbc.batch.internal.BatchingBatch  : Executing batch size: 100
o.h.e.jdbc.batch.internal.BatchingBatch  : Executing batch size: 100
o.h.e.jdbc.batch.internal.BatchingBatch  : Executing batch size: 100
o.h.e.jdbc.batch.internal.BatchingBatch  : Executing batch size: 100
o.h.e.jdbc.batch.internal.BatchingBatch  : Executing batch size: 100
Not only that we can save 500 entities in the time boundaries set by our SLA, but we can save six times more entities without having any issue:
hypersistenceOptimizer.getEvents().clear();

storeService.insertAll(newStores(3000));

assertTrue(hypersistenceOptimizer.getEvents().isEmpty());
Now, if we try to save 3500 entities:
hypersistenceOptimizer.getEvents().clear();

storeService.insertAll(newStores(3500));

assertTrue(hypersistenceOptimizer.getEvents().isEmpty());
We will see that the test fails since Hypersistence Optimizer has detected that the Persistence Context flush operation took more than 500 milliseconds:
Hypersistence Optimizer: CRITICAL - SessionFlushTimeoutEvent -

Flushing the JPA EntityManager or Hibernate Session took [537] ms.
The flush execution time impacts the overall transaction response time,
so make sure that the current JPA EntityManager or Hibernate Session
doesn't contain a very large number of entities.

For more info about this event, check out this User Guide link
-> https://vladmihalcea.com/hypersistence-optimizer/docs/user-guide/#SessionFlushTimeoutEvent
Cool, right?
If you enjoyed this article, I bet you are going to love my Book and Video Courses as well.


Conclusion
Hypersistence Optimizer supports many more checks. It can scan the entities and validate whether you are using the JPA DISTINCT clause efficiently, as well as the ORDER BY clause, and check the number of results that are returned by any given JPQL, Criteria API, or SQL query.
With these performance monitoring checks in place, your Spring Boot application is going to run much faster, and your clients will have a much better experience using it.
All the optimizations presented in this article can be found in this GitHub repository.