SQL Server deadlock trace flags
Are you struggling with performance issues in your Spring, Jakarta EE, or Java EE application?
Imagine having a tool that could automatically detect performance issues in your JPA and Hibernate data access layer long before pushing a problematic change into production!
With the widespread adoption of AI agents generating code in a heartbeat, having such a tool that can watch your back and prevent performance issues during development, long before they affect production systems, can save your company a lot of money and make you a hero!
Hypersistence Optimizer is that tool, and it works with Spring Boot, Spring Framework, Jakarta EE, Java EE, Quarkus, Micronaut, or Play Framework.
So, rather than allowing performance issues to annoy your customers, you are better off preventing those issues using Hypersistence Optimizer and enjoying spending your time on the things that you love!
Introduction
In this article, I’m going to explain how you can find the cause of an SQL Server deadlock using trace flags and the SQL error log.
As a rule of thumb, the more locks are acquired, the higher the probability of a deadlock. And, since SQL Server uses 2PL by default, it’s not uncommon to have to track deadlock issues that affect application performance.
Database locking
All relational database systems use locking. Every time a database record has to be modified, an exclusive lock is acquired to ensure that the row state is changed from one consistent state to another.
When relational database systems were first implemented, the 2PL (Two-Phase Locking) concurrency control mechanism was used to ensure consistency and data integrity. While the 2PL algorithm is easy to implement, it incurs too much locking, as a shared lock is required to be obtained prior to reading any database record.
And, because locking can impact transaction throughput, most relational database systems (e.g., Oracle, PostgreSQL, and the MySQL InnoDB engine) use MVCC (Multi-Version Concurrency Control) to avoid taking shared locks upon reading a database record.
Only SQL Server uses the 2PL concurrency control mechanism by default, although you can also switch MVCC using the Read Committed Snapshot Isolation or the Snapshot Isolation levels.
SQL deadlock
So, no matter if you are using 2PL or MVCC, exclusive locks are always acquired when modifying a table row, and, for this reason, there’s always the possibility of getting a database deadlock.
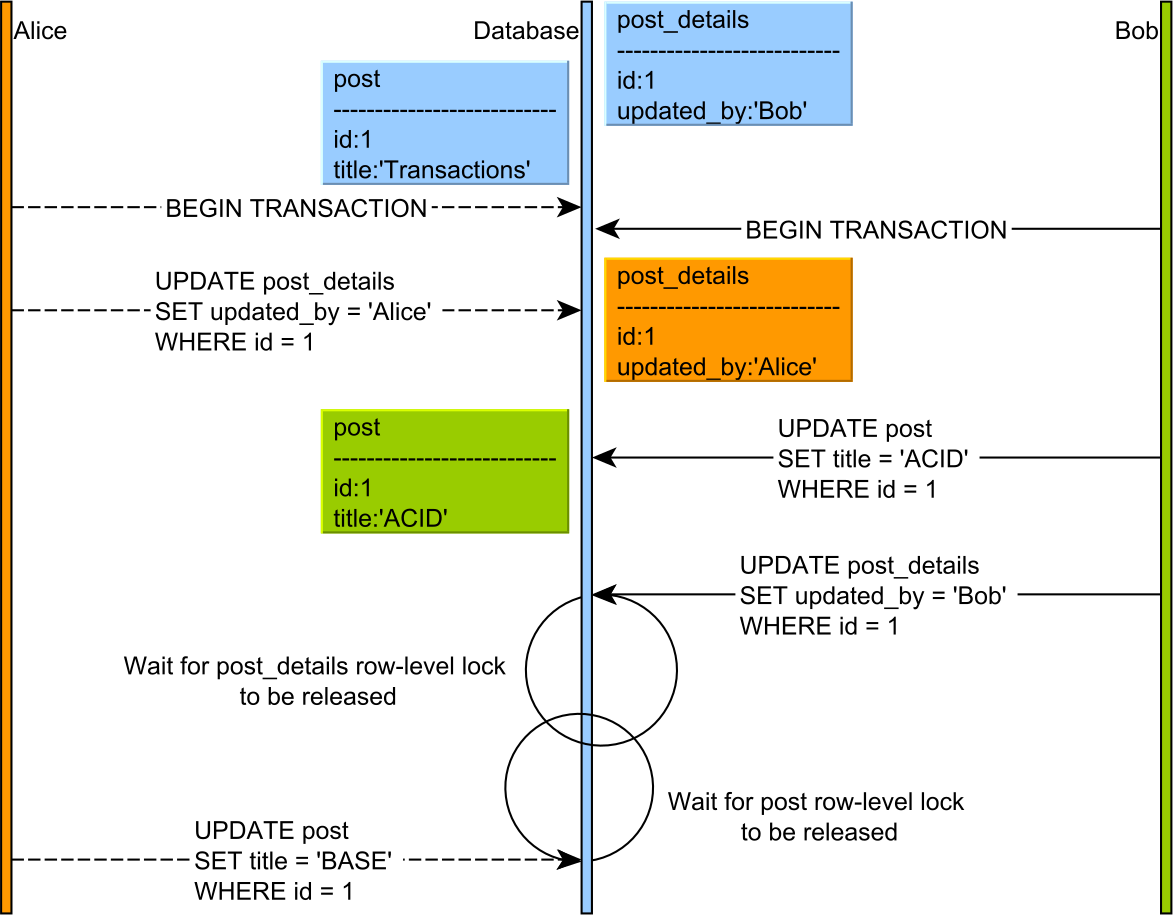
When running the SQL statements depicted in the diagram above, we get the following SQL Server deadlock error:
-- Alice updates the PostDetails entity
UPDATE post_details SET updated_by = 'Alice' WHERE post_id = 1

-- Bob updates the Post entity
UPDATE post SET title = 'ACID' WHERE id = 1

-- Bob wants to update the PostDetails entity
UPDATE post_details SET updated_by = 'Bob' WHERE post_id = 1

-- Alice wants to update the Post entity
UPDATE post SET title = 'BASE' WHERE id = 1

Transaction (Process ID 66) was deadlocked on lock resources with another process
and has been chosen as the deadlock victim. Rerun the transaction.
To track the resources involved in a deadlock, we are going to use the SQL Server deadlock trace flags.
SQL Server deadlock trace flags
SQL Server provides a wide variety of trace flags, which you can activate at runtime and change the default behavior of the database engine.
For tracking deadlocks, there are two trace flags you can use: 1204, 1222.
Once the flags are activated, you can find the deadlock info by accessing the sp_readerrorlog stored procedure.
There’s an overhead associated with activating these trace flags, so you should disable them once you finish capturing the deadlock info you were interested in.
SQL Server deadlock trace flag 1204
The 1204 flag captures some basic info about the lock objects that are participating in a deadlock.
You can activate the 1204 trace flag like this:
DBCC TRACEON (1204, -1)
Now, with the flag in place, we can capture the deadlock info:
DBCC TRACEON 1204, server process ID (SPID) 58.
This is an informational message only; no user action is required.
Deadlock encountered .... Printing deadlock information

Node:1
KEY: 7:72057594186301440 (1b7fe5b8af93) CleanCnt:2 Mode:X Flags: 0x1
 Grant List 1:
   Owner:0x00000202B2119CC0 Mode: X
   Flg:0x40 Ref:0 Life:02000000
   SPID:61 ECID:0 XactLockInfo: 0x00000202A4E3B0A0
   SPID: 61 ECID: 0 Statement Type: UPDATE Line #: 1
   Input Buf: Language Event:
      (@P0 nvarchar(4000),@P1 bigint)
      update post_details
      set updated_by=@P0
      where post_id=@P1
Requested by:
  ResType:LockOwner Stype:'OR'Xdes:0x00000202A4E4E408
  Mode: X SPID:58 BatchID:0 ECID:0
  TaskProxy:(0x00000202B57508A0) Value:0xb2119300 Cost:(0/308)

Node:2
KEY: 7:72057594186366976 (1b7fe5b8af93) CleanCnt:2 Mode:X Flags: 0x1
 Grant List 1:
   Owner:0x00000202B2118800 Mode: X
   Flg:0x40 Ref:0 Life:02000000
   SPID:58 ECID:0 XactLockInfo: 0x00000202A4E4E440
   SPID: 58 ECID: 0 Statement Type: UPDATE Line #: 1
   Input Buf: Language Event:
      (@P0 nvarchar(4000),@P1 bigint)
      update post
      set title=@P0
      where id=@P1
Requested by:
  ResType:LockOwner Stype:'OR'Xdes:0x00000202A4E3B068 Mode: X
  SPID:61 BatchID:0 ECID:0
  TaskProxy:(0x00000202A4E408A0) Value:0xb21191c0 Cost:(0/312)
null
Victim Resource Owner:
 ResType:LockOwner Stype:'OR'Xdes:0x00000202A4E4E408 Mode:
 X SPID:58 BatchID:0 ECID:0
 TaskProxy:(0x00000202B57508A0) Value:0xb2119300 Cost:(0/308)
You can see the sessions that are deadlocked, as well as the statements they were executing and the exclusive locks they are both holding.
After you have finished capturing the deadlock info, you should disable the trace flag, like this:
DBCC TRACEOFF (1204, -1)
SQL Server deadlock trace flag 1222
The 1222 flag captures more detailed info about the lock objects that are being deadlocked.
You can activate the 1222 trace flag like this:
DBCC TRACEON (1222, -1)
Once the flag is activated, we get the following info printed in the SQL error log when the previous deadlock situation occurs.
DBCC TRACEON 1222, server process ID (SPID) 58.
This is an informational message only; no user action is required.
deadlock-list
 deadlock victim=process202a2968ca8
  process-list
   process id=process202a2968ca8 taskpriority=0 logused=308
   waitresource=KEY: 7:72057594186432512 (1b7fe5b8af93) waittime=429
   ownerId=1423029 transactionname=implicit_transaction lasttranstarted=2021-03-31T12:20:27.677
   XDES=0x202b6691068 lockMode=X schedulerid=2 kpid=18156 status=suspended
   spid=58 sbid=0 ecid=0 priority=0 trancount=2 lastbatchstarted=2021-03-31T12:20:27.753
   lastbatchcompleted=2021-03-31T12:20:27.750 lastattention=1900-01-01T00:00:00.750
   hostpid=0 loginname=sa isolationlevel=read committed (2) xactid=1423029 currentdb=7
   lockTimeout=4294967295 clientoption1=671088672 clientoption2=128058
    executionStack
     frame procname=adhoc line=1 stmtstart=62 stmtend=136
     sqlhandle=0x02000000b635e21472fa213cb4a5435aacfea564eca44a2d0000000000000000000000000000000000000000

     frame procname=unknown line=1
     sqlhandle=0x0000000000000000000000000000000000000000000000000000000000000000000000000000000000000000
    inputbuf
       (@P0 nvarchar(4000),@P1 bigint)
       update post
       set title=@P0
       where id=@P1
   process id=process202a2969468 taskpriority=0 logused=312
   waitresource=KEY: 7:72057594186498048 (1b7fe5b8af93) waittime=429
   ownerId=1423040 transactionname=implicit_transaction lasttranstarted=2021-03-31T12:20:27.743
   XDES=0x202a9482408 lockMode=X schedulerid=2 kpid=22028 status=suspended
   spid=61 sbid=0 ecid=0 priority=0 trancount=2 lastbatchstarted=2021-03-31T12:20:27.753
   lastbatchcompleted=2021-03-31T12:20:27.750 lastattention=1900-01-01T00:00:00.750
   hostpid=0 loginname=sa isolationlevel=read committed (2) xactid=1423040 currentdb=7
   lockTimeout=4294967295 clientoption1=671088672 clientoption2=128058
    executionStack
     frame procname=adhoc line=1 stmtstart=62 stmtend=172
     sqlhandle=0x02000000e470980c370b74d85a01cb6c76dd9883cc4b56970000000000000000000000000000000000000000

     frame procname=unknown line=1
     sqlhandle=0x0000000000000000000000000000000000000000000000000000000000000000000000000000000000000000
    inputbuf
       (@P0 nvarchar(4000),@P1 bigint)
       update post_details
       set updated_by=@P0
       where post_id=@P1
  resource-list
   keylock hobtid=72057594186432512 dbid=7 objectname=high_performance_java_persistence.dbo.post
   indexname=PK__post__3213E83F3748A10F id=lock202b2146900 mode=X associatedObjectId=72057594186432512
    owner-list
     owner id=process202a2969468 mode=X
    waiter-list
     waiter id=process202a2968ca8 mode=X requestType=wait
   keylock hobtid=72057594186498048 dbid=7 objectname=high_performance_java_persistence.dbo.post_details
   indexname=PK__post_det__3ED787667769DE93 id=lock202a640cf00 mode=X associatedObjectId=72057594186498048
    owner-list
     owner id=process202a2968ca8 mode=X
    waiter-list
     waiter id=process202a2969468 mode=X requestType=wait
As you can see, the 1222 trace info is more detailed. Not only that we know the session info and the statements, but we can see the transaction isolation levels, and the lock objects involved in the deadlock (e.g., “)
After you have finished capturing the deadlock info, you should disable the trace flag, like this:
DBCC TRACEOFF (1222, -1)
If you enjoyed this article, I bet you are going to love my Book and Video Courses as well.


Conclusion
Both the 1204 and 1222 SQL Server deadlock trace flags can be useful when analyzing a deadlock situation. The former provides basic info while the latter provides more info, but it’s also much more challenging to read.
Don’t forget to disable the trace flags when you are done capturing the deadlock info you are interested in.