PostgreSQL Performance Tuning Settings
Are you struggling with performance issues in your Spring, Jakarta EE, or Java EE application?
Imagine having a tool that could automatically detect performance issues in your JPA and Hibernate data access layer long before pushing a problematic change into production!
With the widespread adoption of AI agents generating code in a heartbeat, having such a tool that can watch your back and prevent performance issues during development, long before they affect production systems, can save your company a lot of money and make you a hero!
Hypersistence Optimizer is that tool, and it works with Spring Boot, Spring Framework, Jakarta EE, Java EE, Quarkus, Micronaut, or Play Framework.
So, rather than allowing performance issues to annoy your customers, you are better off preventing those issues using Hypersistence Optimizer and enjoying spending your time on the things that you love!
Introduction
In this article, we are going to explore various PostgreSQL performance tuning settings that you might want to configure since the default values are not suitable for a QA or production environment.
As explained in this PostgreSQL wiki page, the default PostgreSQL configuration settings were chosen to make it easier to install the database on a wide range of devices that might not have a lot of resources.
Not only can the QA and production system benefit from choosing the proper PostgreSQL performance tuning settings, but even a local database running in Docker can be sped up significantly.
PostgreSQL Performance Tuning Settings
While there are many settings you can configure in PostgreSQL, not all of them are related to performance tuning. Therefore, we are going to focus on the following configuration settings:
max_connectionsshared_bufferseffective_cache_sizework_memmaintenance_work_memautovacuum_max_workerswal_bufferseffective_io_concurrencyrandom_page_costseq_page_costlog_min_duration_statement
If you want to check the default values for your PostgreSQL system, then you can use the following SQL query:
SELECT
    name AS setting_name,
    setting AS setting_value,
    unit AS setting_unit
FROM pg_settings
WHERE name IN (
    'max_connections',
    'shared_buffers',
    'effective_cache_size',
    'work_mem',
    'maintenance_work_mem',
    'autovacuum_max_workers',
    'wal_buffers',
    'effective_io_concurrency',
    'random_page_cost',
    'seq_page_cost',
    'log_min_duration_statement'
)
When running this SQL query on a local PostgreSQL server that came with the default settings, I got the following results:
| setting_name               | setting_value | setting_unit |
| -------------------------- | ------------- | ------------ |
| max_connections            | 100           |              |
| shared_buffers             | 16384         | 8kB          |
| effective_cache_size       | 524288        | 8kB          |
| work_mem                   | 4096          | kB           |
| maintenance_work_mem       | 65536         | kB           |
| autovacuum_max_workers     | 3             |              |
| wal_buffers                | 512           | 8kB          |
| effective_io_concurrency   | 0             |              |
| random_page_cost           | 4             |              |
| seq_page_cost              | 1             |              |
| log_min_duration_statement | -1            | ms           |
On the other hand, if we run the same SQL query on a PostgreSQL database instance hosted by Aiven that runs on the Free-1-5GB plan (1 CPU, 1 GB of RAM, and 5 GB storage), we get the following results:
| setting_name               | setting_value | setting_unit |
| -------------------------- | ------------- | ------------ |
| max_connections            | 20            |              |
| shared_buffers             | 24192         | 8kB          |
| effective_cache_size       | 72704         | 8kB          |
| work_mem                   | 1751          | kB           |
| maintenance_work_mem       | 91136         | kB           |
| autovacuum_max_workers     | 3             |              |
| wal_buffers                | 756           | 8kB          |
| effective_io_concurrency   | 2             |              |
| random_page_cost           | 1             |              |
| seq_page_cost              | 1             |              |
| log_min_duration_statement | 1000          | ms           |
There’s a significant difference between the default options offered by a PostgreSQL database we’ve installed from the official download pack and a managed database offered by a database platform such as Aiven.
On a default PostgreSQL installation, you can change these parameters in the postgresql.conf file located in the PGDATA folder.
On the other hand, Aiven restricts the number of parameters that you can change in order to prevent accidental misconfigurations that could affect the database performance. If you want to see which parameters you can configure in Aiven, then check out the advanced parameters section.
Next, we are going to analyze each of these settings and see why Aiven offers settings that are different from the default ones.
PostgreSQL Connections
As I explained in this article, the relationship between the maximum number of connections and the maximum throughput a given system can deliver is given by the Universal Scalability Law.
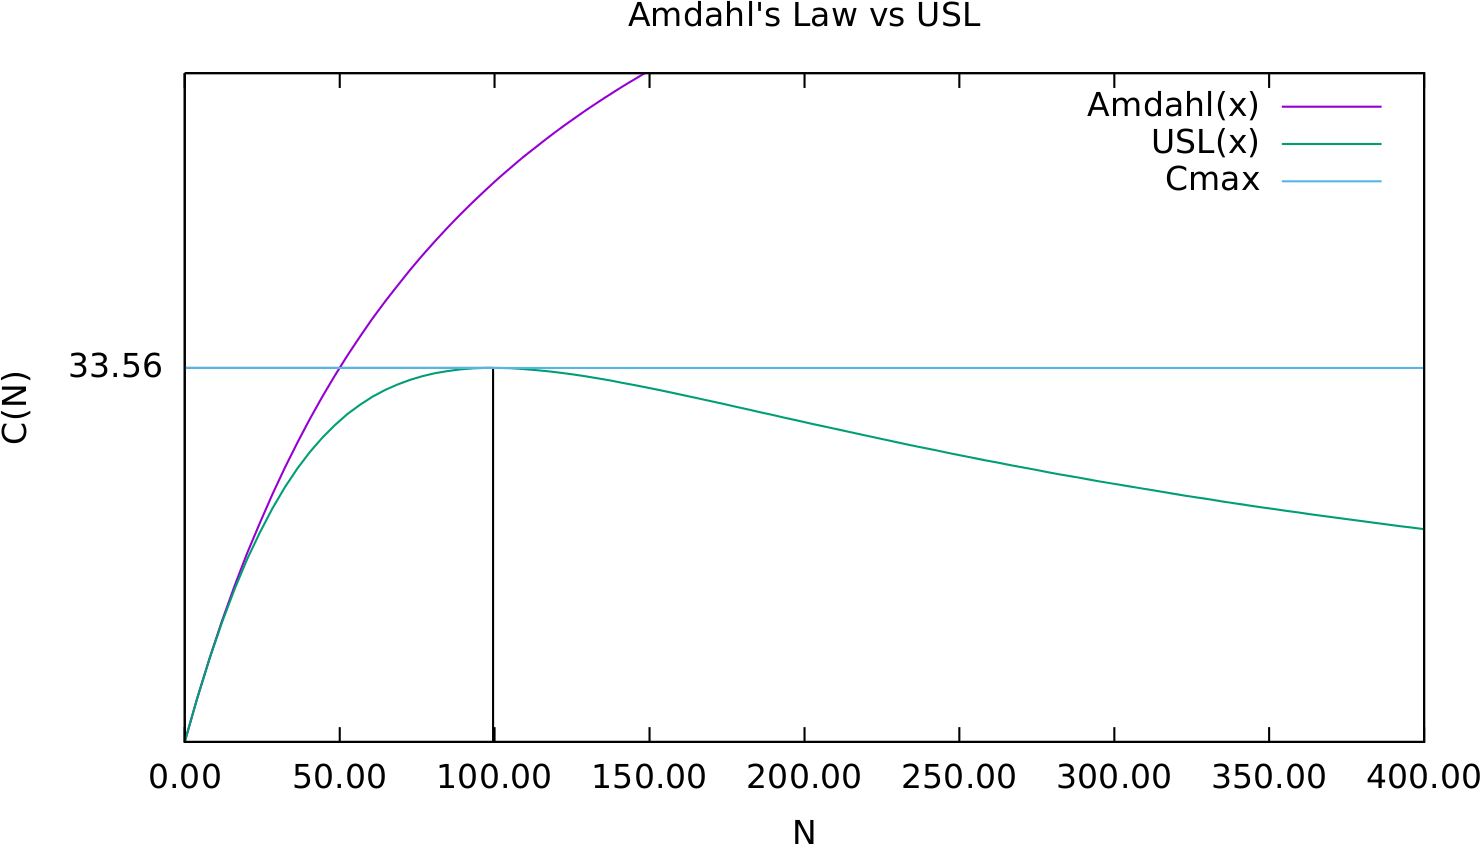
The Universal Scalability Law tells us that if we keep on increasing concurrency after the system reaches the maximum throughput, the cost of coherency or data consistency will only decrease the system throughput.
Therefore, we need to limit the maximum number of connections to the value that can deliver the highest system throughput.
By default, PostgreSQL uses a max_connections value of 100, but that’s way too much for development or test environments that have a small number of CPU cores.
In the case of Aiven, the max_connections configuration is set to the value of 20, which is much lower than the default PostgreSQL value.
If you wonder why Aiven uses a much lower max_connections value, then check out this HikariCP guideline about pool sizing. The maximum number of database connections shouldn’t be very large, as otherwise, it could affect transaction throughput.
So, instead of offering the backend connections directly to its users, Aiven uses PGBouncer to map a large number of client connections to a small number of backend connections, therefore minimizing the server resource consumption.
PostgreSQL Buffer Pool
Unlike Oracle, MySQL, or SQL Server, which can work with a very large Buffer Pool that stores as much data read from the disk, PostgreSQL was designed to use a rather small setting for Shared Buffers, which can be configured via the shared_buffers setting.
The PostgreSQL documentation recommends setting the shared_buffers value to at most 25% of the available RAM.
The remaining 75% of RAM can, therefore, be allocated to the OS kernel, the additional services running by the OS, the client connections, and the OS cache.
Therefore, PostgreSQL is designed to operate with two caches, the Shared Buffers and the OS Cache, as illustrated by the following diagram:

By default, the shared_buffers configuration dictates that PostgreSQL will call 16384 pages of 8kB. So, by default, Shared Buffers is set to a size of 128 MB of RAM, which is very small considering the amount of RAM we have available in our development or testing environments.
On the other hand, Aiven uses 189 MB of RAM, which is more appropriate considering that the Free plan node has just 1GB of RAM available.
Apart from the shared_buffers configuration, we also need to set the effective_cache_size value, which tells PostgreSQL how much RAM is available for caching the data pages, both in the Shared Buffers and in the OS Cache. This setting is used by the PostgreSQL query Optimizer to determine whether indexes fit in RAM.
The default value is set to 524288 pages of 8kB, which is 4GB of RAM. On my machine, which has 32GB of RAM, this value is rather low, and I’d need to raise it to at least 8 or 16 GB.
On the other hand, Aiven uses a value of 72704 pages of 8KB, which is 568 MB. Since the Aiven database server I’m using has just 1GB of RAM, this value is closer to the official recommendation of setting it to a value between 50% and 75% of the available RAM.
PostgreSQL Transient Memory
The work_mem setting allows you to set the maximum amount of memory a query operation can use prior to writing the temporary data to the disk.
The default value is just 4MB, so for 100 connections, PostgreSQL could use 400 MB of transient memory for in-memory query operations (e.g., ORDER BY, Hash Joins, Hash Aggregate, Window Functions).
On the other hand, Aiven uses a work_mem value of 1.7 MB, so for 20 database connections, PostgreSQL could use 34 MB of RAM for query operations.
According to CitusData, the value of work_mem should be chosen based on the types of queries we are running.
If we run many simple queries in parallel, then we don’t need a lot of memory for sorting or hashing.
On the other hand, if we have a batch processing application that runs a small number of complex queries in parallel, then the work_mem seating should be higher.
This setting could be configured on a per session basis, so we can use a general value that’s on the smaller side and increase it only for the sessions that are supposed to run queries that would need more memory for sorting or hashing.
PostgreSQL Maintenance Operations Memory
The maintenance_work_mem setting tells PostgreSQL how much memory it can use for maintenance operations, such as VACUUM, index creation, or other DDL-specific operations. The total memory used for maintenance operations is given by multiplying the number of autovacuum_max_workers with the value of the maintenance_work_mem setting.
The default value of maintenance_work_mem is 64 MB, and when multiplied by the default value of autovacuum_max_workers, which is 3, we get a total memory value of 192 MB for maintenance operations.
On the other hand, the Aiven database node, which has just 1 GB of RAM, sets this value to 89 MB of RAM, and when we multiply it with the value of autovacuum_max_workers, which is 3 for Aiven as well, we get a total value of 267 MB used by Aiven for maintenance operations.
On his blog, Robert Haas recommends finding the largest table and multiplying the maximum number of tuples with the value of 1.2 in order to get a starting value for the maintenance_work_mem setting:
For instance, if your largest table contains 100 million tuples, 100 million * 1.2 = 120 MB, so maybe configure 192MB or even 256MB to be on the safe side.
Therefore, the default Aiven value could be suitable even for a table that has 11 million records.
Another setting used for maintenance operations is wal_buffers, which allows storing in memory the WAL (Write-Ahead Log or Redo Log) segments before writing them to disk. By default, PostgreSQL uses a value that’s 1/32 of the shared_buffer setting. Therefore, my local PostgreSQL uses a value of 4 MB for the wal_buffers setting.
On the other hand, Aiven uses a value of 6 MB since the shared_buffer is set to a larger value.
PostgreSQL I/O Settings
The effective_io_concurrency setting defines the number of simultaneous read and write operations that can be operated by the underlying disk.
The value of 0 on my default PostgreSQL database instance means that the asynchronous I/O operations are disabled.
On the other hand, Aiven uses a value of 2, which means that PostgreSQL can issue 2 I/0 requests simultaneously.
If the underlying disk can handle multiple simultaneous requests, then you should increase the effective_io_concurrency value and test what value provides the best application performance.
When you start testing, you can use the initial values indicated by EnterpriseDB: 2 for HDD and 200 for SSD.
Another setting you might be interested in configuring if you are using a Solid State Drive (SSD) is random_page_cost, which is used by the query Optimizer to calculate the cost of a random access page. When generating the Execution Plan for a given SQL query, the database will compare the random_page_cost and seq_page_cost to determine whether using an index and issuing random access reads against the table pages is less costly than simply scanning the entire table.
On my local PostgreSQL instance, random_page_cost has a default value of 4, and seq_page_cost has a default value of 1, meaning that PostgreSQL will consider that the random access read is 4 times slower than a sequential read.
On the other hand, Aiven uses the same value of 1 for both random_page_cost and seq_page_cost, which is a typical setting when using Solid State Drives because the cost of sequential and random access is similar when using an SSD, as opposed to when using an HDD.
PostgreSQL Log Settings
The log_min_duration_statement allows PostgreSQL to log statements that take longer than the provided threshold value.
By default, this feature is disabled, hence the value of -1 on my local PostgreSQL database instance.
On the other hand, Aiven uses a value of 1000 ms, meaning that every SQL query that takes longer than a second will be printed in the database log for us to investigate it.
While the SQL query log is a good tool for starting your SQL performance investigations, there are also advanced tools that can provide AI-based performance-tuning suggestions, such as EverSQL by Aiven.
EverSQL provides both performance monitoring and query optimizations. So, not only can it identify slow queries, but EverSQL can suggest to you how you can rewrite your queries, as well as which indexes you should add or remove in order to speed up your query execution.
If you enjoyed this article, I bet you are going to love my Book and Video Courses as well.


Conclusion
Without setting PostgreSQL properly, application performance might suffer even if all the SQL queries have been perfectly written. That’s because the database system is not going to be able to take advantage of the underlying hardware on which it runs, therefore affecting query performance.
It’s very important to acknowledge that, by default, PostgreSQL doesn’t come pre-configured for modern hardware on which we are going to run our database systems.
Managed database systems, such as Aiven, provide much better defaults, and analyzing a pre-configured PostgreSQL database system can give us the opportunity to learn how to configure various database settings, as well as help us get a better understanding of how the database system works behind the scenes.
In the end, the default values are just a starting point, as ultimately, we should test application performance against various settings and fine-tune the database based on our specific needs.
This research was funded by Aiven and conducted in accordance with the blog ethics policy.
While the article was written independently and reflects entirely my opinions and conclusions, the amount of work involved in making this article happen was compensated by Aiven.


Thanks, as always.