How to expose Hibernate Statistics via JMX
Are you struggling with performance issues in your Spring, Jakarta EE, or Java EE application?
Imagine having a tool that could automatically detect performance issues in your JPA and Hibernate data access layer long before pushing a problematic change into production!
With the widespread adoption of AI agents generating code in a heartbeat, having such a tool that can watch your back and prevent performance issues during development, long before they affect production systems, can save your company a lot of money and make you a hero!
Hypersistence Optimizer is that tool, and it works with Spring Boot, Spring Framework, Jakarta EE, Java EE, Quarkus, Micronaut, or Play Framework.
So, rather than allowing performance issues to annoy your customers, you are better off preventing those issues using Hypersistence Optimizer and enjoying spending your time on the things that you love!
Introduction
As already explained, Hibernate provides a very flexible statistics mechanism. The Hibernate metrics can be accessed either programmatically via the org.hibernate.stat.Statistics interface or via JMX (Java Management Extensions).
In this article, you are going to see how you can expose the Hibernate statistics metrics using JMX.
How to expose Hibernate Statistics via #Java Management Extensionshttps://t.co/1LfJcWYvHU pic.twitter.com/cam2NhCw47
— Java (@java) May 9, 2019
Configuration
By default, the Hibernate statistics mechanism is not enabled, so you need to activate it using the following configuration property:
<property name="hibernate.generate_statistics" value="true"/>
To expose the Hibernate metrics via JMX, you also need to set the hibernate.jmx.enabled configuration property:
<property name="hibernate.jmx.enabled" value="true"/>
<property name="hibernate.jmx.usePlatformServer" value="true"/>
Now, Hibernate is going to collect metrics and expose them via JMX.
Since Hibernate 5.4.2, the
Statisticsobject is now exposed via JMX. Therefore, you should consider upgrading your Hibernate version if you want to benefit from this feature.
Testing time
To see the Hibernate statistics metrics via JMX, we need to open JConsole and attach a new connection to our Hibernate application. Afterward, you need to go to the MBeans tab and locate the org.hibernate.core package as illustrated by the following screenshot.
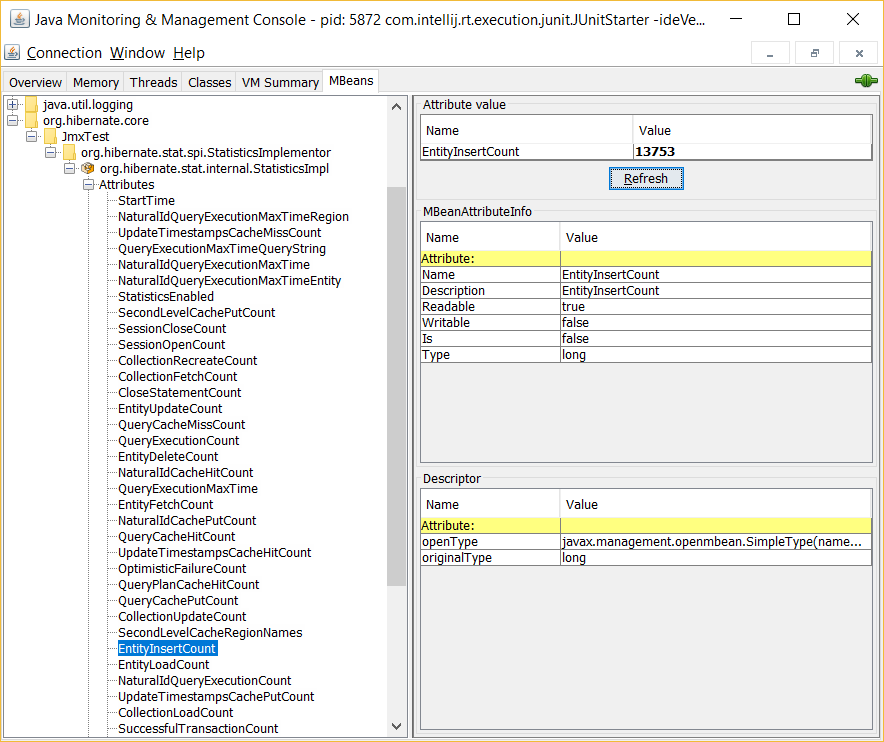
Notice the org.hibernate.stat.internal.StatisticsImpl MBean which provides access to all metrics supported by the Hibernate Statistics interface.
Cool, right?
If you enjoyed this article, I bet you are going to love my Book and Video Courses as well.


Conclusion
The advantage of exposing the Hibernate statistics via JMX is that you can further export these metrics to an APM (Application Performance Monitoring) tool which aggregates metrics from different sources (e.g. OS, database, cache) and correlate them so that you get a better insight into the inner workings of your system.