How to get the query execution plan on SQL Server
Are you struggling with performance issues in your Spring, Jakarta EE, or Java EE application?
Imagine having a tool that could automatically detect performance issues in your JPA and Hibernate data access layer long before pushing a problematic change into production!
With the widespread adoption of AI agents generating code in a heartbeat, having such a tool that can watch your back and prevent performance issues during development, long before they affect production systems, can save your company a lot of money and make you a hero!
Hypersistence Optimizer is that tool, and it works with Spring Boot, Spring Framework, Jakarta EE, Java EE, Quarkus, Micronaut, or Play Framework.
So, rather than allowing performance issues to annoy your customers, you are better off preventing those issues using Hypersistence Optimizer and enjoying spending your time on the things that you love!
Introduction
In this article, we are going to see how we can get the query execution plan when using the SQL Server relational database system.
The execution plan allows you to understand the operations done by the database engine when executing a specific SQL query.
SQL execution plan
The steps involved in executing a given SQL query can be visualized in the following diagram.
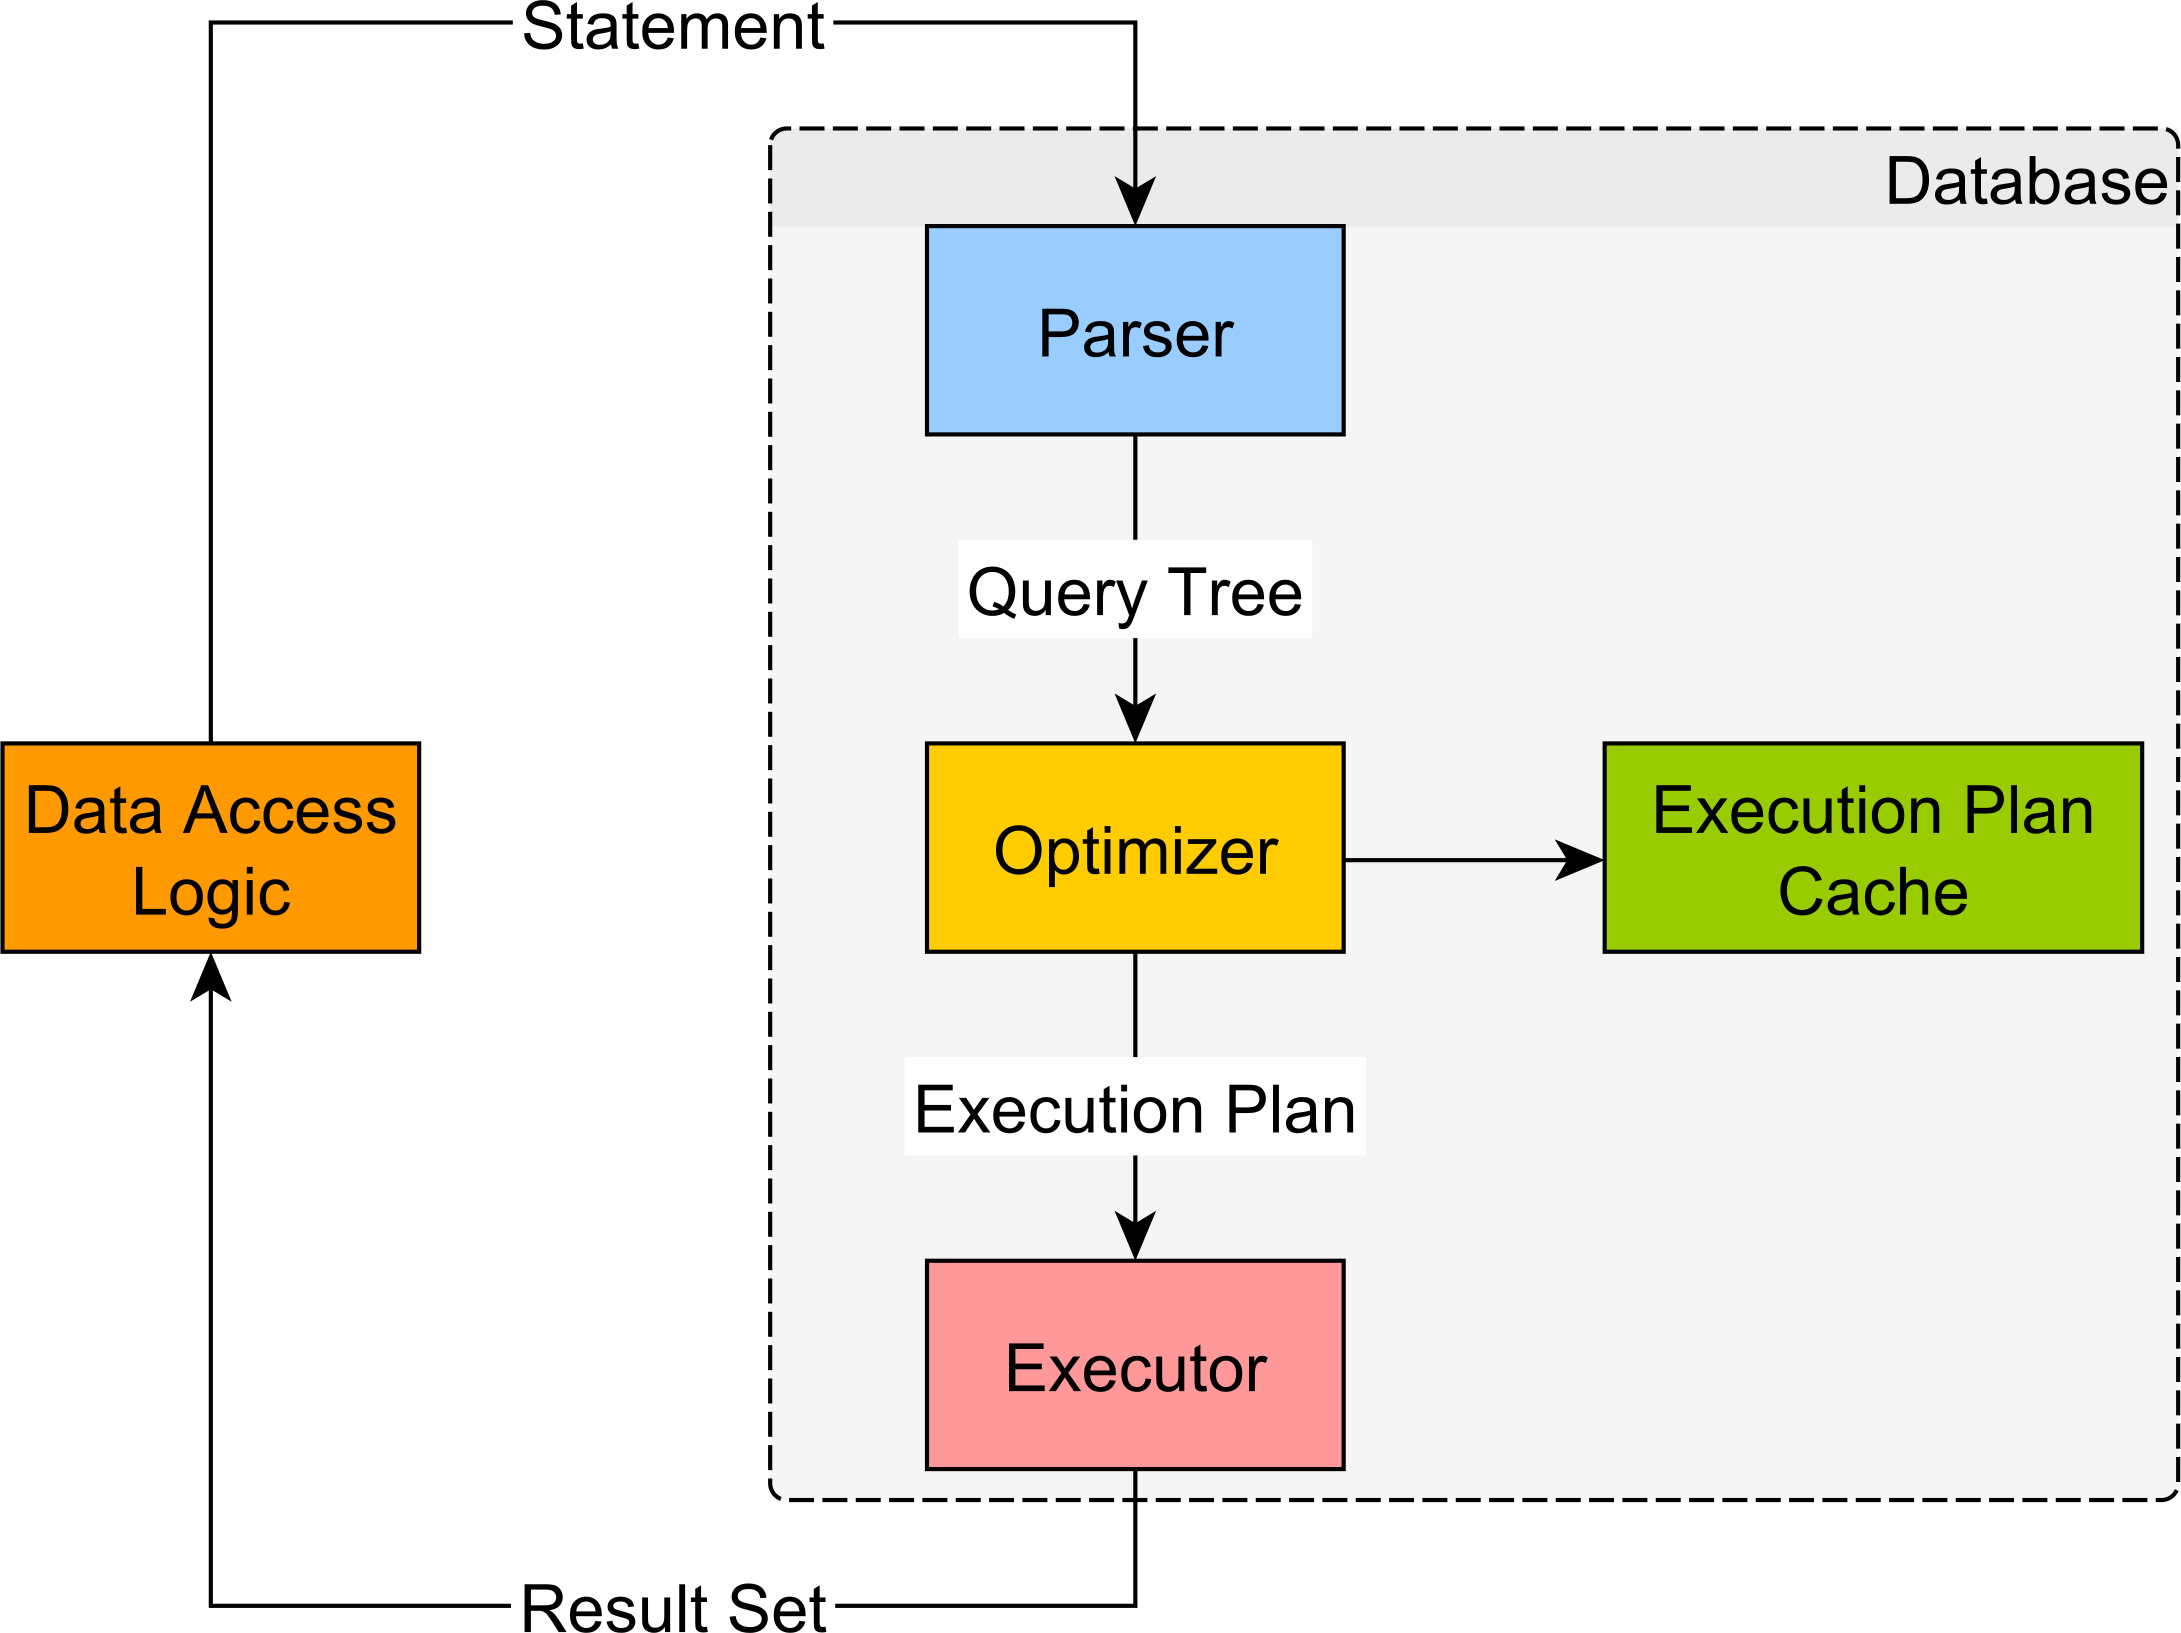
The first step is to parse the SQL query into an AST (Abstract Syntax Tree). During parsing, the database validates the SQL query syntax and the referenced database resources (e.g., tables, columns). The Parser can preoptimize the query by eliminating parts which are not redundant.
The resulting Query Tree is sent to the Optimizer, which produces a step-by-step list of operations that are needed in order to fetch the desired result set.
The resulting execution plan is sent to the Executor, which runs it and sents the fetched result set back to the database client.
The estimated SQL execution plan
The estimated execution plan is generated by the Optimizer without running the SQL query.
In order to get the estimated execution plan, you need to enable the SHOWPLAN_ALL setting prior to executing the query.
SET SHOWPLAN_ALL ON
Now, when running the following SQL query:
SELECT p.id
FROM post p
WHERE EXISTS (
  SELECT 1
  FROM post_comment pc
  WHERE
    pc.post_id = p.id AND
    pc.review = 'Bingo'
)
ORDER BY p.title
OFFSET 20 ROWS
FETCH NEXT 10 ROWS ONLY
SQL Server will generate the following estimated execution plan:
| NodeId | Parent | LogicalOp            | EstimateRows | EstimateIO  | EstimateCPU | AvgRowSize | TotalSubtreeCost | EstimateExecutions |
|--------|--------|----------------------|--------------|-------------|-------------|------------|------------------|--------------------|
| 1      | 0      | NULL                 | 10           | NULL        | NULL        | NULL       | 0.03374284       | NULL               |
| 2      | 1      | Top                  | 10           | 0           | 3.00E-06    | 15         | 0.03374284       | 1                  |
| 4      | 2      | Distinct Sort        | 30           | 0.01126126  | 0.000504114 | 146        | 0.03373984       | 1                  |
| 5      | 4      | Inner Join           | 46.698       | 0           | 0.00017974  | 146        | 0.02197446       | 1                  |
| 6      | 5      | Clustered Index Scan | 43           | 0.004606482 | 0.0007543   | 31         | 0.005360782      | 1                  |
| 7      | 5      | Clustered Index Seek | 1            | 0.003125    | 0.0001581   | 146        | 0.0161733        | 43                 |
For brevity, not all columns have been included in the estimated execution plan above. Nevertheless, you can get a picture of what the plan contains and how it can help you figure out what the database engine does behind the scenes when executing a given SQL query.
After running the query we are interested in getting the estimated execution plan, you need to disable the SHOWPLAN_ALL as, otherwise, the current database session will only generate estimated execution plan instead of executing the provided SQL queries.
SET SHOWPLAN_ALL OFF
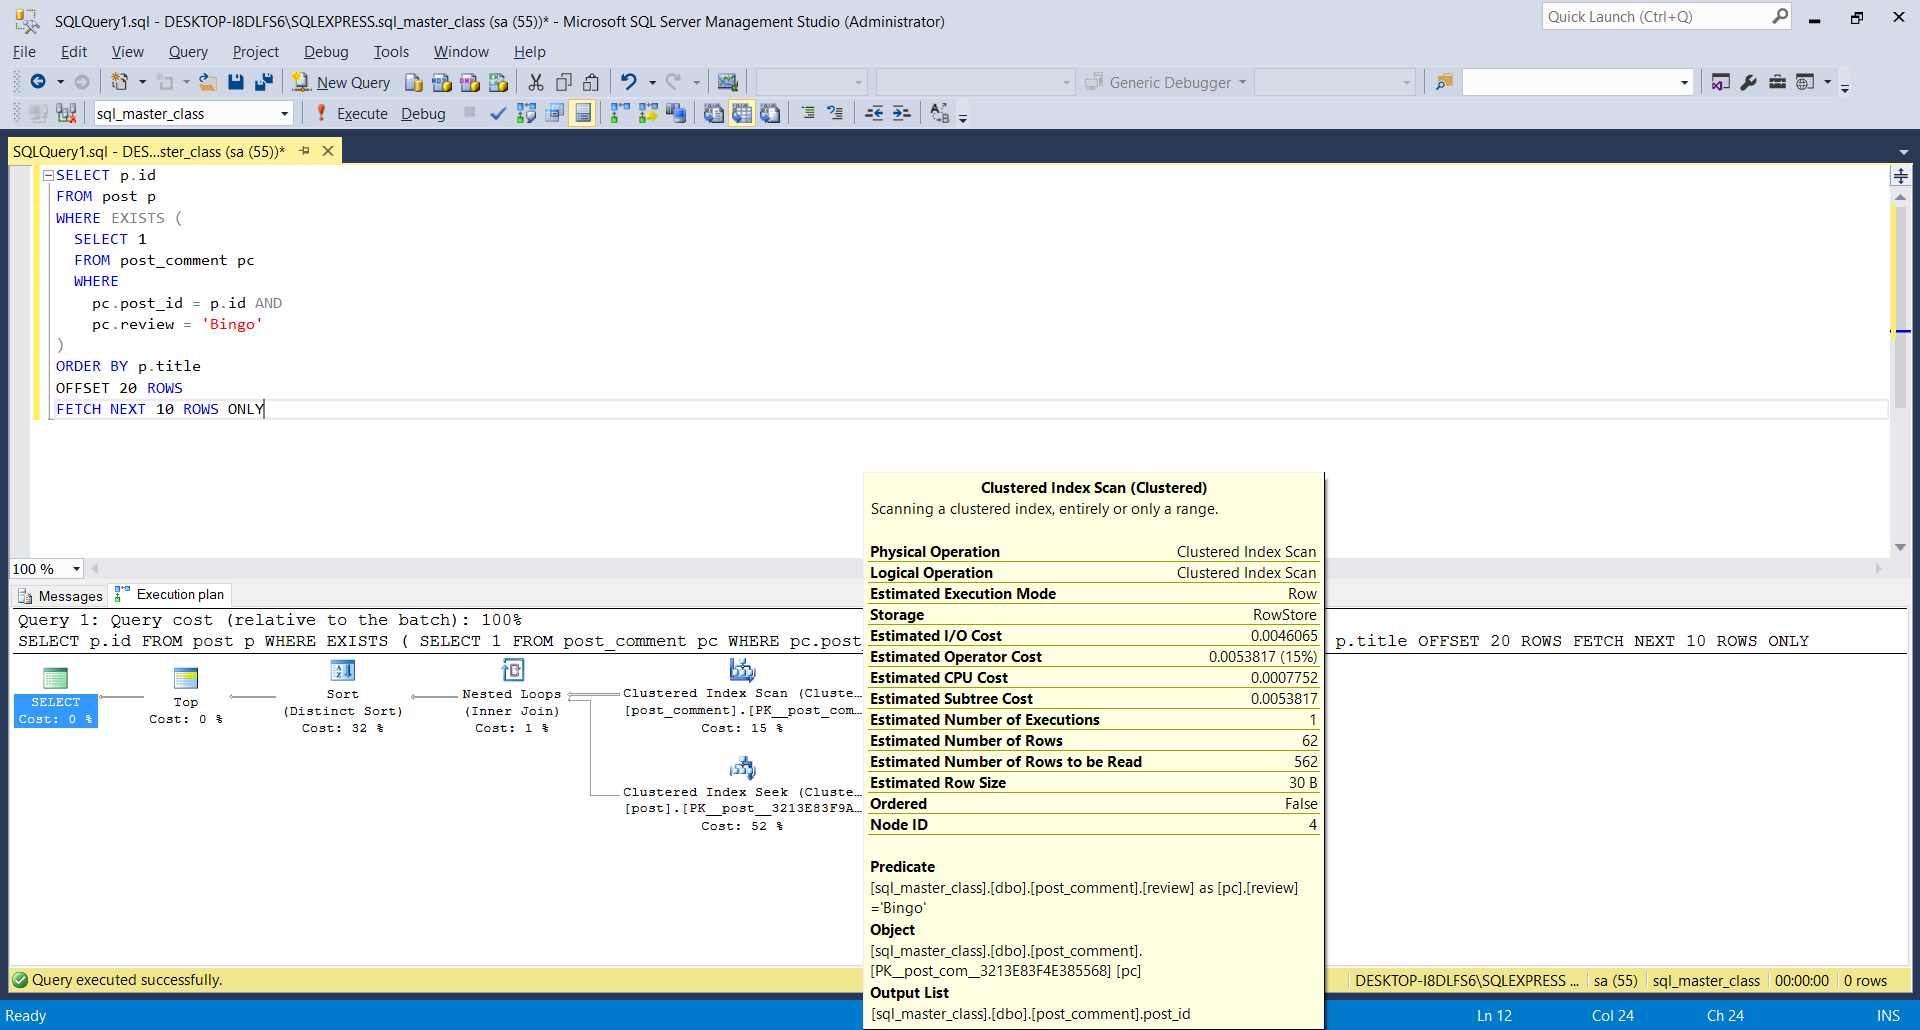
SQL Server Management Studio estimated plan
In the SQL Server Management Studio application, you can easily get the estimated execution plan for any SQL query by hitting the CTRL+L key shortcut.
The actual SQL execution plan
The actual SQL execution plan is generated by the Optimizer when running the SQL query. If the database table statistics are accurate, the actual plan should not differ significantly from the estimated one.
SET STATISTICS IO, TIME, PROFILE ON
To get the actual execution plan on SQL Server, you need to enable the STATISTICS IO, TIME, PROFILE settings, as illustrated by the following SQL command:
SET STATISTICS IO, TIME, PROFILE ON
Now, when running the previous query, SQL Server is going to generate the following execution plan:
| Rows | Executes | NodeId | Parent | LogicalOp            | EstimateRows | EstimateIO  | EstimateCPU | AvgRowSize | TotalSubtreeCost |
|------|----------|--------|--------|----------------------|--------------|-------------|-------------|------------|------------------|
| 10   | 1        | 1      | 0      | NULL                 | 10           | NULL        | NULL        | NULL       | 0.03338978       |
| 10   | 1        | 2      | 1      | Top                  | 1.00E+01     | 0           | 3.00E-06    | 15         | 0.03338978       |
| 30   | 1        | 4      | 2      | Distinct Sort        | 30           | 0.01126126  | 0.000478783 | 146        | 0.03338679       |
| 41   | 1        | 5      | 4      | Inner Join           | 44.362       | 0           | 0.00017138  | 146        | 0.02164674       |
| 41   | 1        | 6      | 5      | Clustered Index Scan | 41           | 0.004606482 | 0.0007521   | 31         | 0.005358581      |
| 41   | 41       | 7      | 5      | Clustered Index Seek | 1            | 0.003125    | 0.0001581   | 146        | 0.0158571        |

SQL Server parse and compile time:
   CPU time = 8 ms, elapsed time = 8 ms.

(10 row(s) affected)
Table 'Worktable'. Scan count 0, logical reads 0, physical reads 0, read-ahead reads 0, lob logical reads 0, lob physical reads 0, lob read-ahead reads 0.
Table 'post'. Scan count 0, logical reads 116, physical reads 0, read-ahead reads 0, lob logical reads 0, lob physical reads 0, lob read-ahead reads 0.
Table 'post_comment'. Scan count 1, logical reads 5, physical reads 0, read-ahead reads 0, lob logical reads 0, lob physical reads 0, lob read-ahead reads 0.

(6 row(s) affected)

SQL Server Execution Times:
   CPU time = 0 ms,  elapsed time = 1 ms.
After running the query we are interested in getting the actual execution plan, you need to disable the STATISTICS IO, TIME, PROFILE ON settings like this:
SET STATISTICS IO, TIME, PROFILE OFF
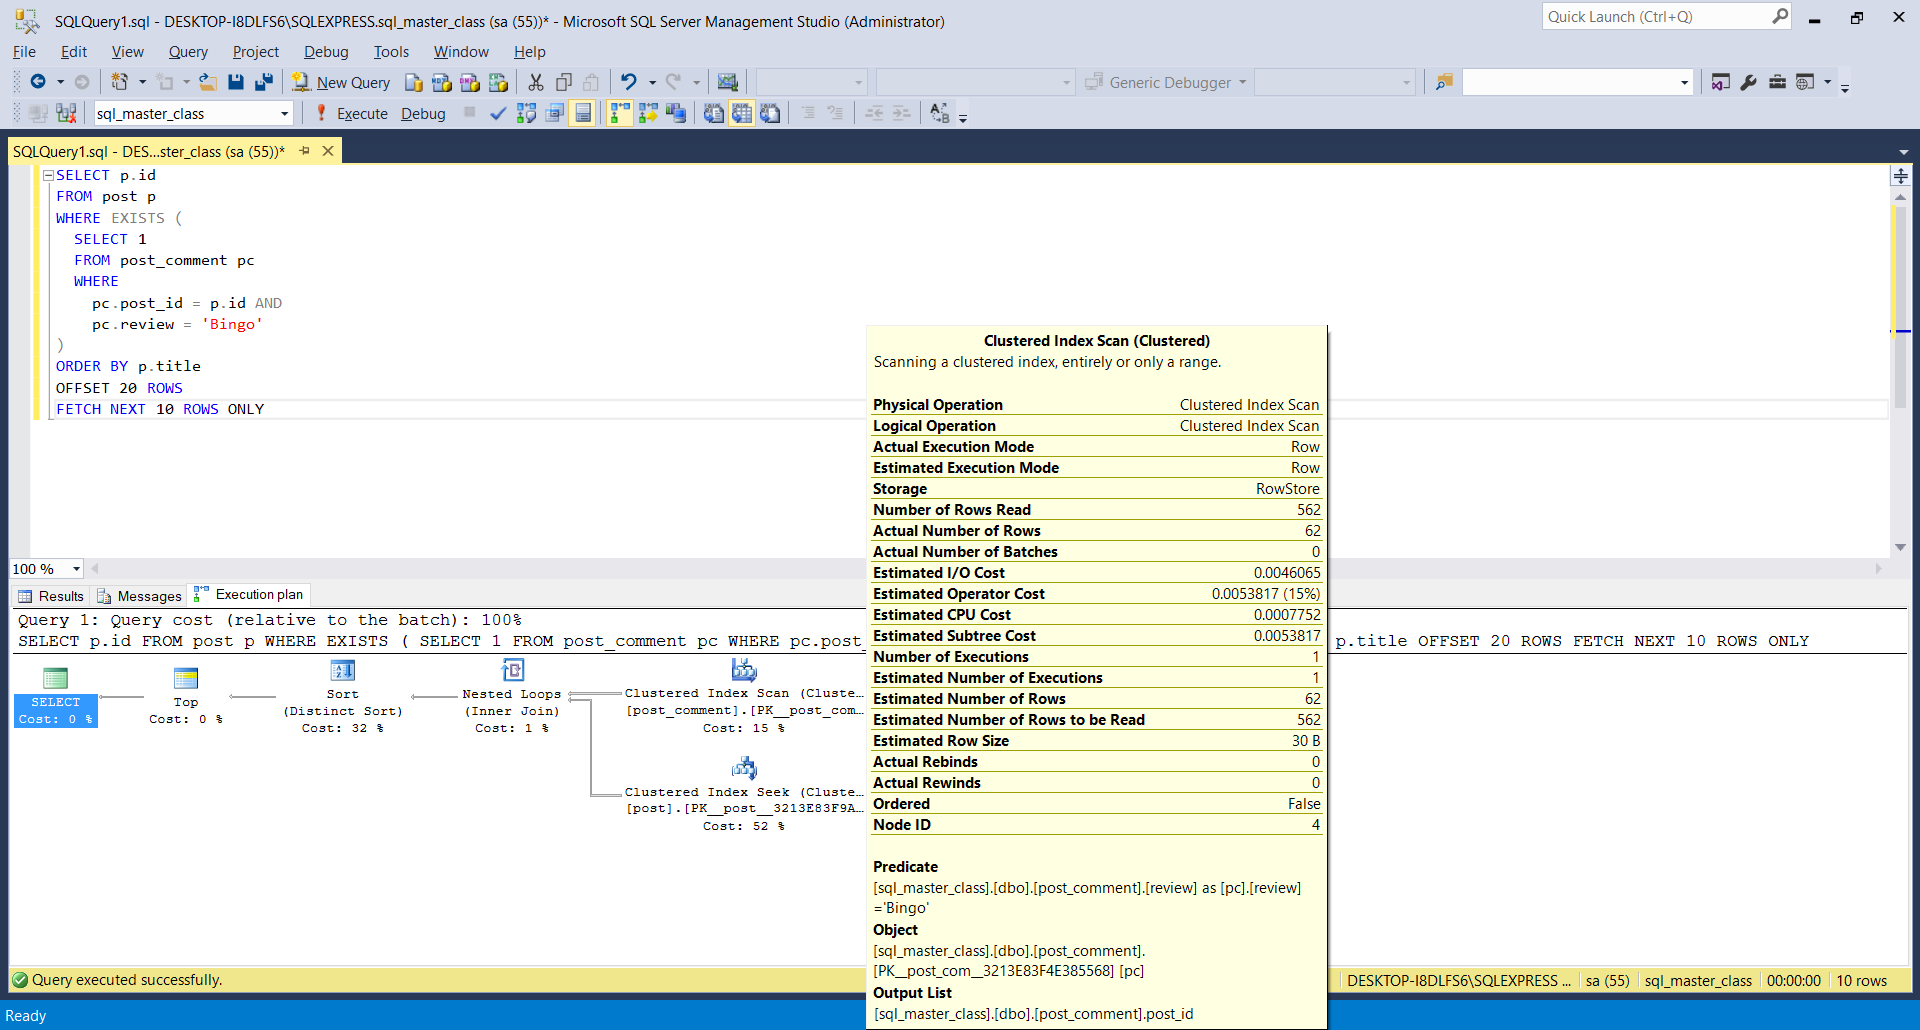
SQL Server Management Studio actual plan
In the SQL Server Management Studio application, you can easily get the estimated execution plan for any SQL query by hitting the CTRL+M key shortcut.
If you enjoyed this article, I bet you are going to love my Book and Video Courses as well.


Conclusion
If you need to optimize the execution of a given SQL query, you have to inspect the execution plan in order to determine what makes the query run slowly. Without visualizing the query execution plan, you cannot tell what the database does under the hood when running a certain SQL statement.