How to calculate percentiles with SQL PERCENTILE_CONT
Are you struggling with performance issues in your Spring, Jakarta EE, or Java EE application?
What if there were a tool that could automatically detect what caused performance issues in your JPA and Hibernate data access layer?
Wouldn’t it be awesome to have such a tool to watch your application and prevent performance issues during development, long before they affect production systems?
Well, Hypersistence Optimizer is that tool! And it works with Spring Boot, Spring Framework, Jakarta EE, Java EE, Quarkus, Micronaut, or Play Framework.
So, rather than fixing performance issues in your production system on a Saturday night, you are better off using Hypersistence Optimizer to help you prevent those issues so that you can spend your time on the things that you love!
Introduction
In this article, we are going to investigate how to calculate percentiles with the SQL PERCENTILE_CONT function.
Domain Model
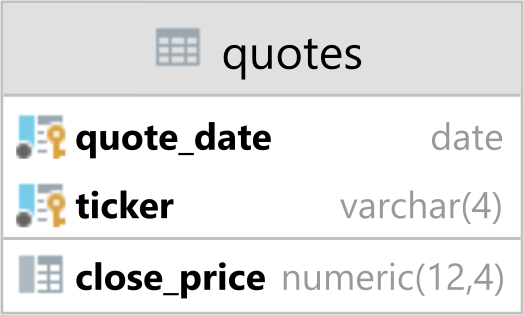
Let’s consider we have the following quotes table that holds the historical price values of various stocks and indexes:
The quotes table is populated with data that looks like this:
| quote_date | ticker | close_price |
| ---------- | ------ | ----------- |
| 2023-12-04 | SPX    | 4569.7800   |
| 2023-12-05 | SPX    | 4567.1800   |
| 2023-12-06 | SPX    | 4549.3400   |
| 2023-12-07 | SPX    | 4585.5900   |
| 2023-12-08 | SPX    | 4604.3700   |
| 2023-12-11 | SPX    | 4622.4400   |
| 2023-12-12 | SPX    | 4643.7000   |
| 2023-12-13 | SPX    | 4707.0900   |
| 2023-12-14 | SPX    | 4719.5500   |
| 2023-12-15 | SPX    | 4719.1900   |
SQL PERCENTILE_CONT
The SQL Standard provides support for a great variety of Window Functions, such as DENSE_RANK, and Aggregation Functions, like PERCENTILE_CONT, PERCENTILE_DISC, or LISTAGG.
The PERCENTILE_CONT is an inverse distribution aggregate function that we can use to calculate percentiles.
While Window Functions use the OVER clause, the Aggregate Functions use the WITHIN GROUP clause. Therefore, the PERCENTILE_CONT is defined as follows:
PERCENTILE_CONT(percentage) WITHIN GROUP (ORDER BY sort_criteria)
To calculate the Median (50th), 75th, 95th, and 99th percentiles of the S&P 500 index value between 2019 and 2023, we can use the following SQL query with PERCENTILE_CONT:
SELECT
    PERCENTILE_CONT(0.50) WITHIN GROUP(ORDER BY close_price) AS median,
    PERCENTILE_CONT(0.75) WITHIN GROUP(ORDER BY close_price) AS p75,
    PERCENTILE_CONT(0.95) WITHIN GROUP(ORDER BY close_price) AS p95,
    PERCENTILE_CONT(0.99) WITHIN GROUP(ORDER BY close_price) AS p99
FROM
    quotes
WHERE
    ticker = 'SPX' AND
    quote_date BETWEEN DATE '2019-01-01' AND DATE '2023-12-31'
The SQL query above runs on both PostgreSQL and Oracle. For SQL Server, you will need to modify it as explained further on in the SQL server section.
When running the above SQL query, we get the following values:
| median  | p75     | p95               | p99               |
| ------- | ------- | ----------------- | ----------------- |
| 3907.45 | 4305.09 | 4602.737999999999 | 4750.138400000001 |
If we want to calculate these percentiles per year, then we can use the following SQL query:
SELECT
    EXTRACT(YEAR FROM quote_date) AS year,
    PERCENTILE_CONT(0.50) WITHIN GROUP(ORDER BY close_price) AS median,
    PERCENTILE_CONT(0.75) WITHIN GROUP(ORDER BY close_price) AS p75,
    PERCENTILE_CONT(0.95) WITHIN GROUP(ORDER BY close_price) AS p95,
    PERCENTILE_CONT(0.99) WITHIN GROUP(ORDER BY close_price) AS p99
FROM
    quotes
WHERE
    ticker = 'SPX' AND
    quote_date BETWEEN DATE '2019-01-01' AND DATE '2023-12-31'
GROUP BY
    EXTRACT(YEAR FROM quote_date)
ORDER BY
    year
And we will get the following results:
| year | median   | p75               | p95               | p99                |
| ---- | -------- | ----------------- | ----------------- | ------------------ |
| 2019 | 2919.025 | 3001.615          | 3160.353          | 3227.3273000000004 |
| 2020 | 3276.02  | 3408.63           | 3690.79           | 3729.44            |
| 2021 | 4304     | 4486.287499999999 | 4699.282999999999 | 4782.4638          |
| 2022 | 4027.26  | 4338.87           | 4588.280000000001 | 4719.71            |
| 2023 | 4291.16  | 4466.95           | 4634.133          | 4772.3392          |
PERCENTILE_CONT on SQL Server
In SQL Server, the PERCENTILE_CONT function requires both the WITHIN GROUP and the OVER clause, and the result set is closer to the typical of a Window Function, rather than the one we would expect from an Aggregate Function. For this reason, you will also need to use DISTINCT, otherwise the percentile value will be repeated for every matching record in the quotes table.
Therefore, if you’re using SQL Server, you will need to change the first SQL query like this:
SELECT DISTINCT
    PERCENTILE_CONT(0.50) WITHIN GROUP(ORDER BY close_price)
        OVER (PARTITION BY ticker) AS median,
    PERCENTILE_CONT(0.75) WITHIN GROUP(ORDER BY close_price)
        OVER (PARTITION BY ticker) AS p75,
    PERCENTILE_CONT(0.95) WITHIN GROUP(ORDER BY close_price)
        OVER (PARTITION BY ticker) AS p95,
    PERCENTILE_CONT(0.99) WITHIN GROUP(ORDER BY close_price)
        OVER (PARTITION BY ticker) AS p99
FROM
    quotes
WHERE
    ticker = 'SPX' AND
    quote_date BETWEEN '2019-01-01' AND '2023-12-31'
Notice that we need to use DISTINCT and provide an OVER clause as well.
The second SQL query that calculates the percentile values per year looks like this for SQL Server:
SELECT DISTINCT
    YEAR(quote_date) AS year,
    PERCENTILE_CONT(0.50) WITHIN GROUP(ORDER BY close_price)
        OVER (PARTITION BY YEAR(quote_date)) AS median,
    PERCENTILE_CONT(0.75) WITHIN GROUP(ORDER BY close_price)
        OVER (PARTITION BY YEAR(quote_date)) AS p75,
    PERCENTILE_CONT(0.95) WITHIN GROUP(ORDER BY close_price)
        OVER (PARTITION BY YEAR(quote_date)) AS p95,
    PERCENTILE_CONT(0.99) WITHIN GROUP(ORDER BY close_price)
        OVER (PARTITION BY YEAR(quote_date)) AS p99
FROM
    quotes
WHERE
    ticker = 'SPX' AND
    quote_date BETWEEN '2019-01-01' AND '2023-12-31'
ORDER BY
    year
That’s it!
If you enjoyed this article, I bet you are going to love my Book and Video Courses as well.


Conclusion
Calculating percentile values is a very common task when dealing with metrics or other time series.
While the SQL Standard defines the PERCENTILE_CONT function, the syntax may differ from one relational database to another, so make sure you check the database manual before starting using it.


PERCENTILE_CONT is an aggregate function, not a window function
That’s true. According to the standard, it’s an aggregate function. In SQL Server, it behaves like a window function, hence the mandatory OVER and the need of DISTINCT.
What’s even more confusing is that the MariaDB manual also calls it a window function:
https://mariadb.com/kb/en/percentile_cont/