Percona PMM – A beginner’s guide
Are you struggling with performance issues in your Spring, Jakarta EE, or Java EE application?
Imagine having a tool that could automatically detect performance issues in your JPA and Hibernate data access layer long before pushing a problematic change into production!
With the widespread adoption of AI agents generating code in a heartbeat, having such a tool that can watch your back and prevent performance issues during development, long before they affect production systems, can save your company a lot of money and make you a hero!
Hypersistence Optimizer is that tool, and it works with Spring Boot, Spring Framework, Jakarta EE, Java EE, Quarkus, Micronaut, or Play Framework.
So, rather than allowing performance issues to annoy your customers, you are better off preventing those issues using Hypersistence Optimizer and enjoying spending your time on the things that you love!
Introduction
This article is a beginner’s guide for the Percona Monitoring and Management (PMM), a tool that’s very handy when it comes to analyzing a given database system.
PMM was released in 2016, and initially, it was available for MySQL. However, since 2018, it supports monitoring PostgreSQL as well, so once you learn it you can use it with the two most popular open-source relational database systems.
What is PMM
PMM is an open-source tool, written in Go and hosted on GitHub, that allows you to monitor a relational database system via a pmm-client that sends the database usage metrics to a pmm-server that aggregates all the data and provides it to you via a Grafana dashboard UI.
You can use PMM to monitor the resource usage of a given database system, like CPU, RAM, Network, or Disk IO, and you can also analyze queries and spot slow-running queries or queries that are fast but which are executed more than necessary, like N+1 query issues.
How to install PMM
The easiest way to install PMM is to use Docker since the image is hosted on Docker Hub.
The first thing we need to do is pull the Docker image using the following command:
docker pull percona/pmm-server:2
Now, you need to create a pmm-data persistent storage that is required to be mounted to the /srv path.
docker create --volume /srv --name pmm-data percona/pmm-server:2 /bin/true
The next step is to create the PMM Docker container.
If you are using Windows, you can run the following command:
docker run --detach --restart always ^
--name pmm-server ^
--publish 9090:80 ^
--volumes-from pmm-data ^
percona/pmm-server:2
For a Unix-based system, use \ instead of ^ for the new-line separator, like this:
docker run --detach --restart always \
--name pmm-server \
--publish 9090:80 \
--volumes-from pmm-data \
percona/pmm-server:2
The publish attribute allows us to map port 80 in the PMM docker container to port 9090 on the host OS.
The volumes-from attribute allows us to reference the pmm-data volume we created earlier.
To validate that the container was created, run a docker ps -a command, and you should see something like this:
> docker ps -a

NAMES       IMAGE                   COMMAND                 PORTS

pmm-server  percona/pmm-server:2    /opt/entrypoint.sh      0.0.0.0:9090 -ᐳ 80/tcp
pmm-data    percona/pmm-server:2    /bin/true
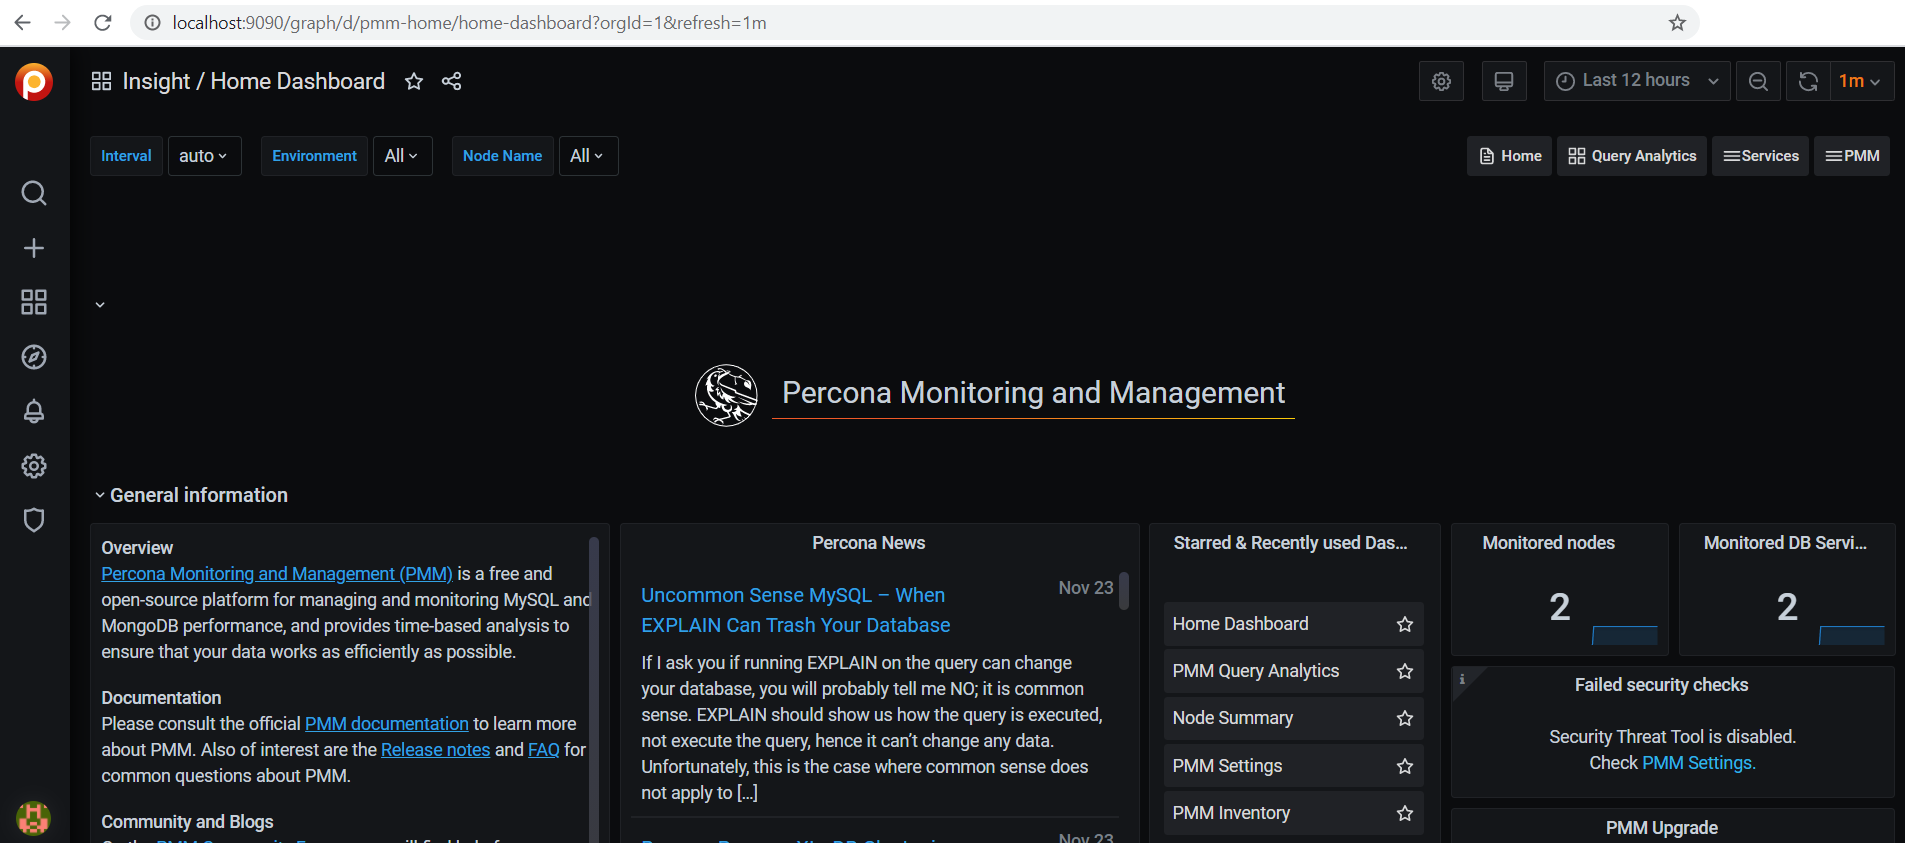
If you open the browser and load the localhost:9090 URL address, you should see something like this:
How to monitor a PostgreSQL or MySQL database using PMM
To monitor a new database, go to the Search button on the left-side menu and search for Add instance, as illustrated by the following diagram:

After you click the PMM Add Instance icon and choose the DB type, you want to monitor.
For a remote MySQL database (even one installed on the host OS), choose the Adding a Remote MySQL Instance option and add the DB credentials as illustrated by the following diagram:

For a remote PostgreSQL database (even one installed on the host OS), choose the Adding a Remote PostgreSQL Instance option and add the DB credentials as illustrated by the following diagram:
Monitoring a database using PMM
Once you added the database you are interested in monitoring, you can inspect the queries that are executed and see which ones take the longest or are executed the most per second.
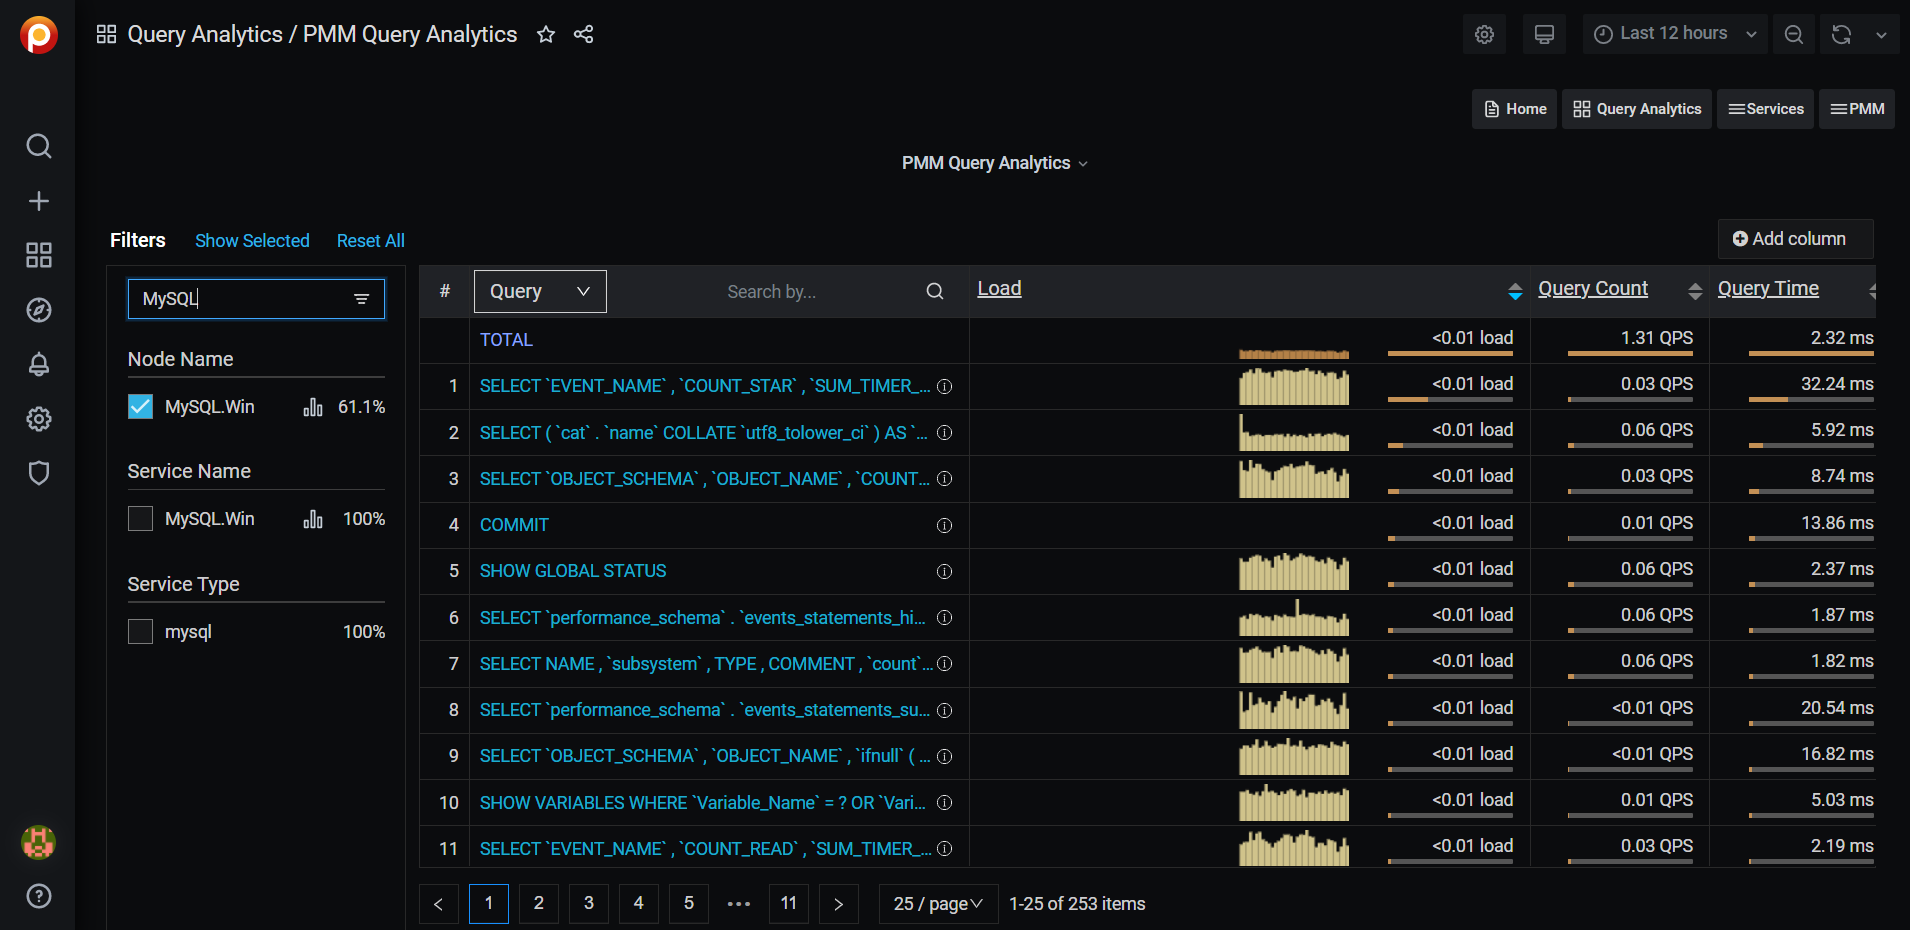
Cool, right?
If you enjoyed this article, I bet you are going to love my Book and Video Courses as well.


Conclusion
The Percona PMM tool is very handy when it comes to monitoring a PostgreSQL or MySQL database and analyzing the underlying SQL queries that get executed.
And, because it’s available on Docker Hub, you can easily install it on your machine or a given application performance monitoring server.