JDBC Profiling with VisualVM
Are you struggling with performance issues in your Spring, Jakarta EE, or Java EE application?
Imagine having a tool that could automatically detect performance issues in your JPA and Hibernate data access layer long before pushing a problematic change into production!
With the widespread adoption of AI agents generating code in a heartbeat, having such a tool that can watch your back and prevent performance issues during development, long before they affect production systems, can save your company a lot of money and make you a hero!
Hypersistence Optimizer is that tool, and it works with Spring Boot, Spring Framework, Jakarta EE, Java EE, Quarkus, Micronaut, or Play Framework.
So, rather than allowing performance issues to annoy your customers, you are better off preventing those issues using Hypersistence Optimizer and enjoying spending your time on the things that you love!
Introduction
In this article, we are going to see how we can do JDBC profiling using the VisualVM tool to find slow-running SQL queries or discover N+1 query issues.
VisualVM
VisualVM is an OSS tool that allows us to inspect the JVM and the Java applications running inside the Java Virtual Machine.
You can download VisualVM from this link and install it on your system. After installing it, you just need to run the following executable:
> bin/visualvm
And you will get information about the Java applications that are currently running on your system:
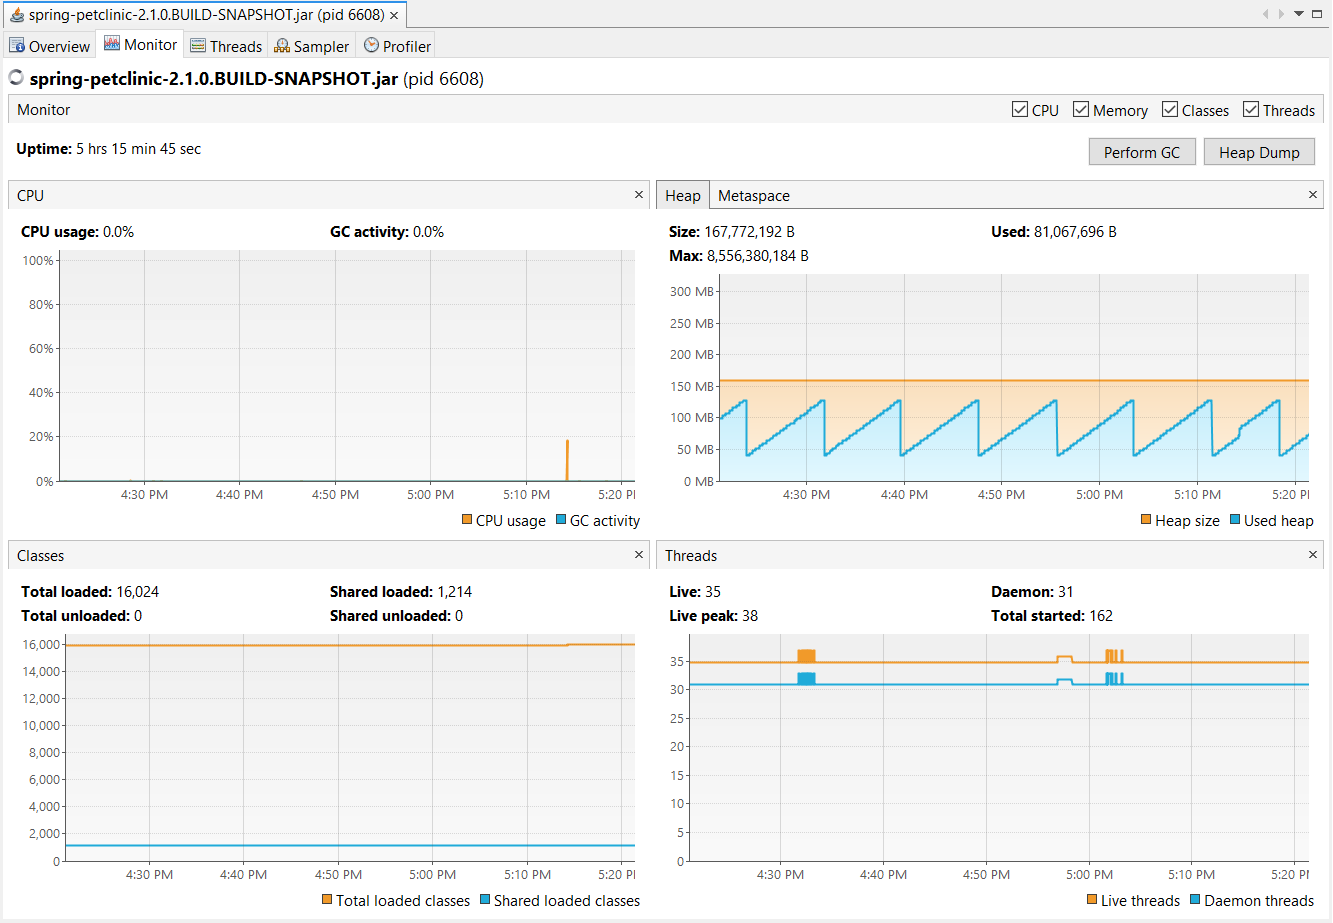
Notice that we can see information about CPU usage, memory allocation, thread, or class loading information.
However, there’s much more you can do with VisualVM than just monitoring the resources consumed by your Java application.
JDBC Profiling with VisualVM
If you go to the Profile tab and click the JDBC button, you can start the JDBC profiling, which will capture the SQL statements that are executed, as illustrated by the following screenshot:
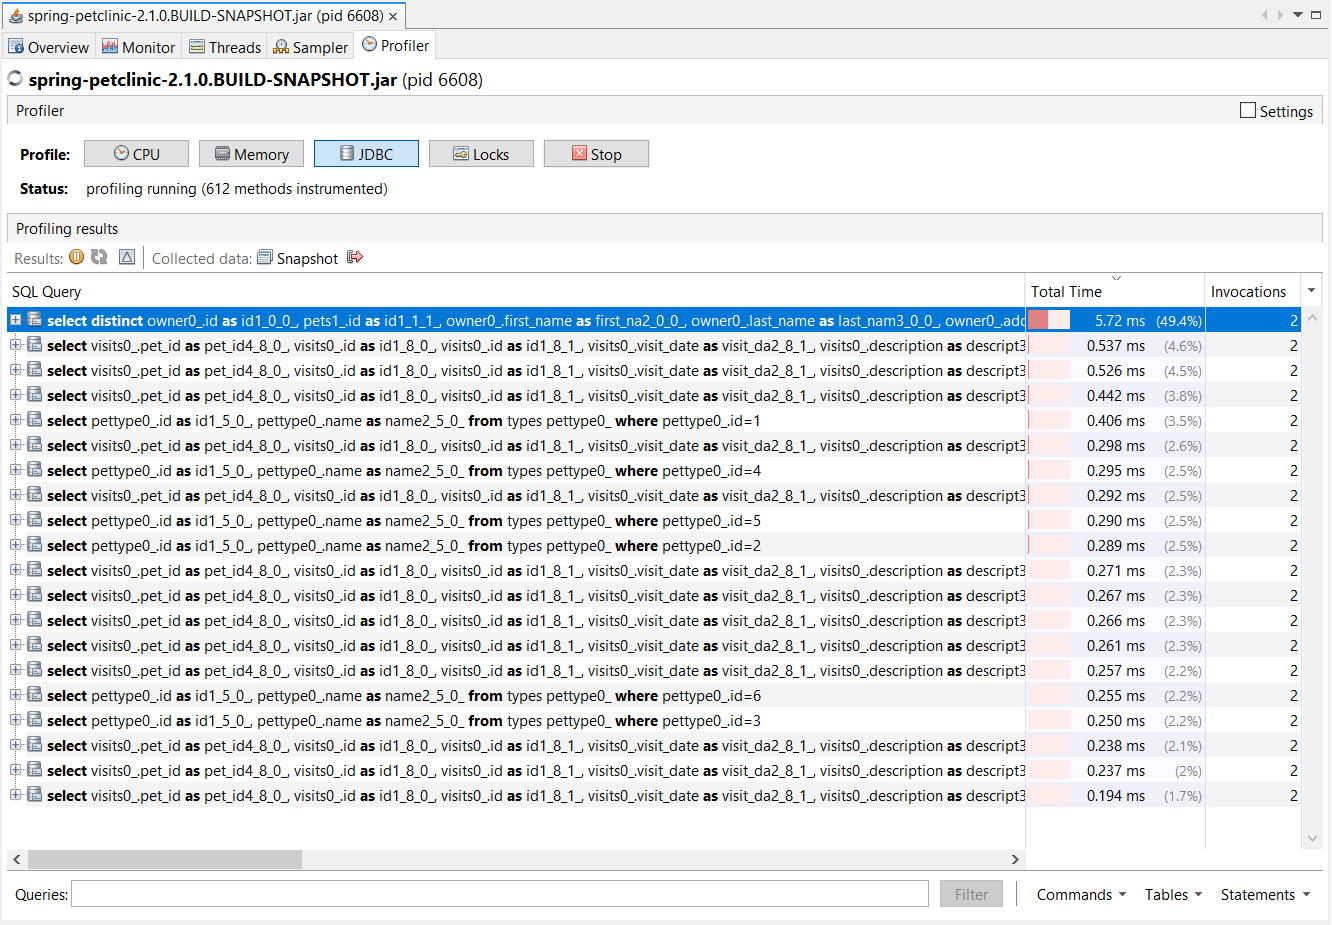
The SQL statements are ordered by the execution time in descending order, so the first ones are the long-running queries you might want to investigate.
If you click on an SQL statement, you will get the Java stack trace that generated the query:

Knowing the stack trace of a given SQL query can be very useful as you can easily spot the service method where the query in question originated.
To spot N+1 query issues, you just have to look for queries that initialize a single entity or collection by a given parent entity identifier, as illustrated by the following screenshot:

The reason why we got this N+1 query issue in this Spring PetClinic
application is due to the implicit and explicit FetchType.EAGER associations contained in the Pet parent entity:
@Entity
@Table(name = "pets")
public class Pet extends NamedEntity {

    @Column(name = "birth_date")
    @DateTimeFormat(pattern = "yyyy-MM-dd")
    private LocalDate birthDate;

    @ManyToOne
    @JoinColumn(name = "type_id")
    private PetType type;

    @ManyToOne
    @JoinColumn(name = "owner_id")
    private Owner owner;

    @OneToMany(
        cascade = CascadeType.ALL,
        mappedBy = "petId",
        fetch = FetchType.EAGER
    )
    private Set<Visit> visits = new LinkedHashSet<>();
}
In our case, the Pet entity was fetched by this entity query that you can spot as the first query in the previous JDBC profile screenshots:
select distinct
    owner0_.id as id1_0_0_,
    pets1_.id as id1_1_1_,
    owner0_.first_name as first_na2_0_0_,
    owner0_.last_name as last_nam3_0_0_,
    owner0_.address as address4_0_0_,
    owner0_.city as city5_0_0_,
    owner0_.telephone as telephon6_0_0_,
    pets1_.name as name2_1_1_,
    pets1_.birth_date as birth_da3_1_1_,
    pets1_.owner_id as owner_id4_1_1_,
    pets1_.type_id as type_id5_1_1_,
    pets1_.owner_id as owner_id4_1_0__,
    pets1_.id as id1_1_0__
from
    owners owner0_
left outer join
    pets pets1_ on owner0_.id=pets1_.owner_id
where
    owner0_.last_name like '%'
Because the Pet entity is fetched without also fetching all its FetchType.EAGER associations, Hibernate has to resort to secondary queries that cause the N+1 query issues.
For more details about why
FetchType.EAGERis a terrible mapping mistake, check out this article.
If you enjoyed this article, I bet you are going to love my Book and Video Courses as well.


Conclusion
VisualVM is a wonderful tool for monitoring application performance, and its JDBC profiling capabilities can be very handy.
Because we can spot both long-running entity queries and N+1 query issues, you might want to give this tool a try and make sure you discover such issues long before they affect the users of your application.