Book Review – Troubleshooting Java
Are you struggling with performance issues in your Spring, Jakarta EE, or Java EE application?
Imagine having a tool that could automatically detect performance issues in your JPA and Hibernate data access layer long before pushing a problematic change into production!
With the widespread adoption of AI agents generating code in a heartbeat, having such a tool that can watch your back and prevent performance issues during development, long before they affect production systems, can save your company a lot of money and make you a hero!
Hypersistence Optimizer is that tool, and it works with Spring Boot, Spring Framework, Jakarta EE, Java EE, Quarkus, Micronaut, or Play Framework.
So, rather than allowing performance issues to annoy your customers, you are better off preventing those issues using Hypersistence Optimizer and enjoying spending your time on the things that you love!
Introduction
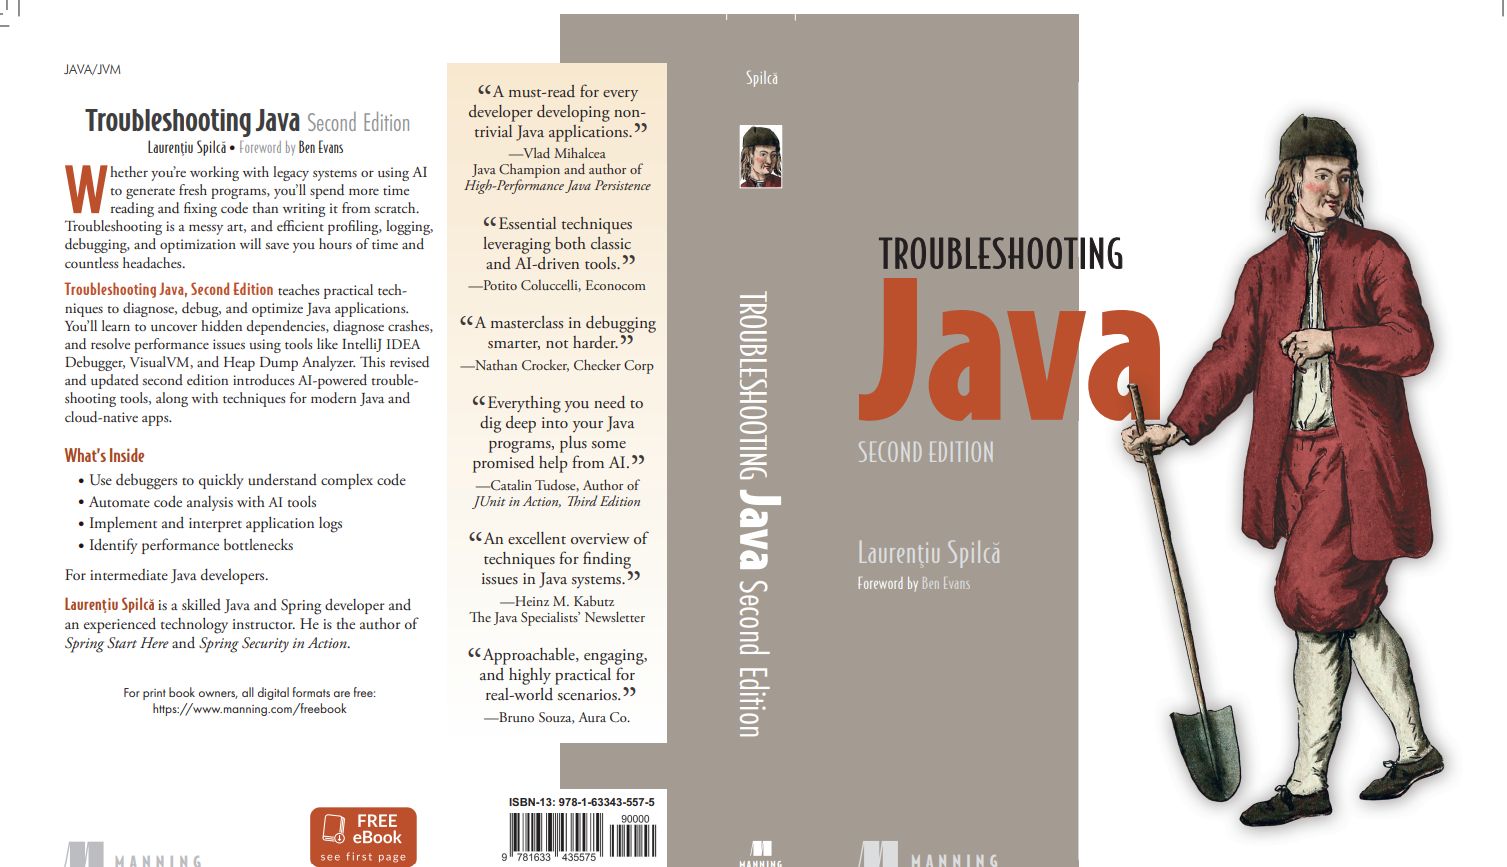
My friend, Laurentiu Spilca, has been working on the second edition of his Troubleshooting Java book, and when I was asked to review it, I was more than happy to do it since the book features a lot of topics that I’m also very interested in, such as performance tuning and query optimization.
Audience
This book is useful for any Java developer because it teaches you how to get the best out of your IDE debugger, as well as showing you how to profile Java applications and fix very complex issues, such as deadlocks.
No matter your level of seniority, I believe that any one of us has something to learn from it.
Content
Troubleshooting Java has 388 pages, 4 parts, and 13 chapters.
The first part teaches you how to approach your code analysis and conduct your investigations using logging and debugging. Beyond the basics of logging, you will learn about conditional breakpoints, non-suspending breakpoints, rewinding via frame dropping, and more.
The logging part is also very useful because it addresses the challenge of how much data you should be logging without affecting application performance.
In the second part, you will learn about profiling using VisualVM so that you can investigate how many resources (e.g., CPU, memory) your current application is consuming.
You will also learn the difference between profiling and sampling. I liked the part about profiling SQL queries, which is very useful for any Java application that uses a relational database system.
This part covers lock monitoring and deadlocking, which are very useful if you are developing highly concurrent Java applications. You will also learn about thread dumps and what options you have to read them efficiently.
The third part is dedicated to memory monitoring and management. You will learn about memory sampling, generating and inspecting heap dumps, and getting the best out of GC logs.
The fourth part is about troubleshooting distributed systems. You will learn about the benefits of using tracing and telemetry, and how you can prevent cascading failures, retry storms, or timeout mismatches.
At the end of the book, you will find several Annexes that explain the following topics in great detail:
- Java Memory Model
- Java Thread Lifecycle
- Java Thread Synchronization
- Common Thread Issues (deadlocks, livelocks, starvation, race conditions)
Conclusion
If you want to become a better software engineer, you are going to learn a lot from this book because many of the troubleshooting techniques explained in this book are available to other programming languages too.
Apart from this book, Laurentiu has authored two other books that have awesome reviews, such as:
I had the chance of meeting Laurentiu in person at DevTalks Cluj-Napoca, where, apart from presenting, he also moderated the Java stage, and he did a wonderful job there as well!