MySQL Query Optimization with Releem
Are you struggling with performance issues in your Spring, Jakarta EE, or Java EE application?
Imagine having a tool that could automatically detect performance issues in your JPA and Hibernate data access layer long before pushing a problematic change into production!
With the widespread adoption of AI agents generating code in a heartbeat, having such a tool that can watch your back and prevent performance issues during development, long before they affect production systems, can save your company a lot of money and make you a hero!
Hypersistence Optimizer is that tool, and it works with Spring Boot, Spring Framework, Jakarta EE, Java EE, Quarkus, Micronaut, or Play Framework.
So, rather than allowing performance issues to annoy your customers, you are better off preventing those issues using Hypersistence Optimizer and enjoying spending your time on the things that you love!
Introduction
In this article, I’m going to show you how to optimize the queries executed by a Spring application running on MySQL using Releem.
For a short introduction about Releem, check out this previous article, in which I explained how to set up Releem to collect metrics from your MySQL database.
Spring Petclinic application
The application under test is going to be the well-known Spring Petclinic that we are going to run using the MySQL profile:
java -jar -D"spring.profiles.active"=mysql spring-petclinic-3.4.0-SNAPSHOT.jar
After starting the application, we are going to run the petclinic_test_plan.jmx JMeter test plan that is located in the src/test/jmeter folder of the Spring Petclinic application.
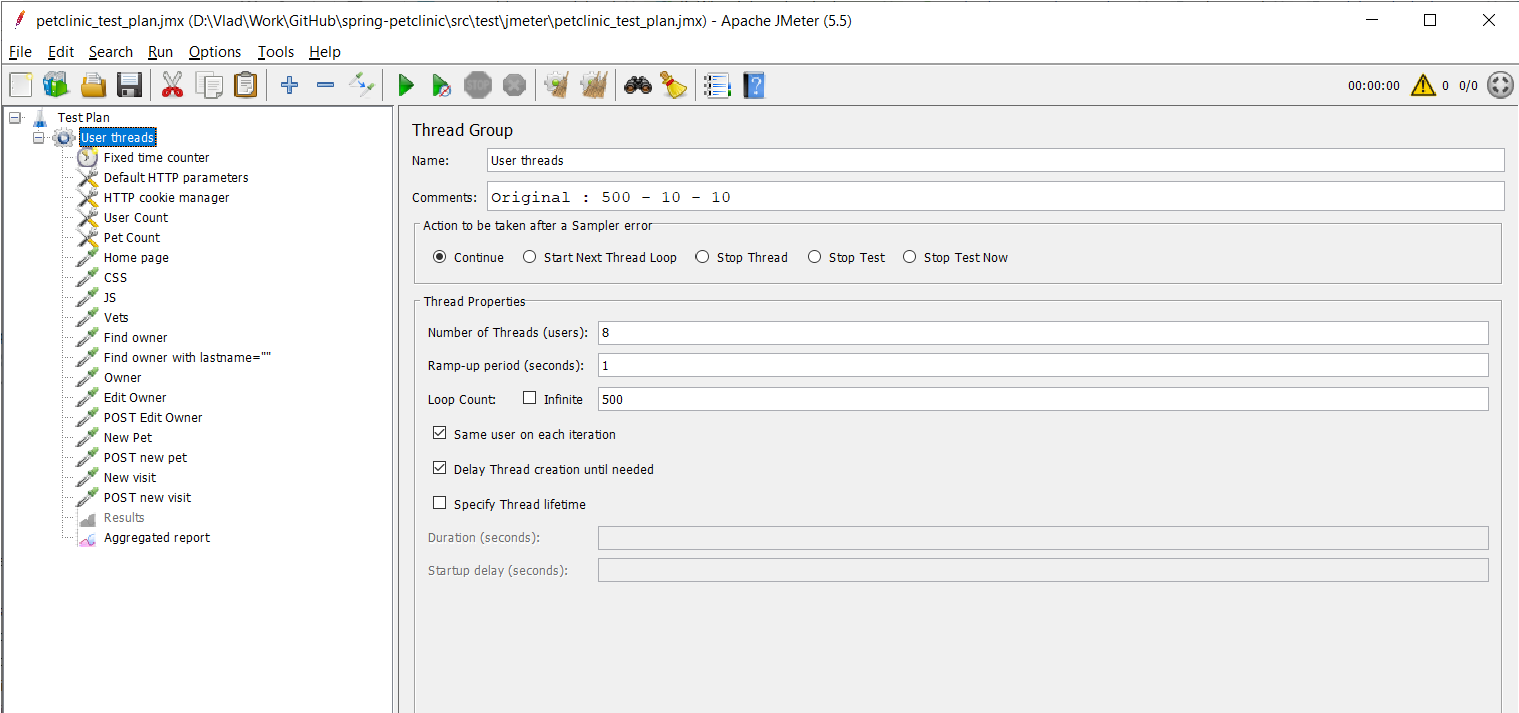
This test plan allows us to test both reads and writes, and we are going to use Releem to investigate how the Spring Petclinic application responds under heavy load.
Investigating CPU spikes
Releem allows us to monitor CPU spikes caused by heavy traffic, and when running the JMeter test with a significant number of threads, we can see that the CPU is spiking under load:
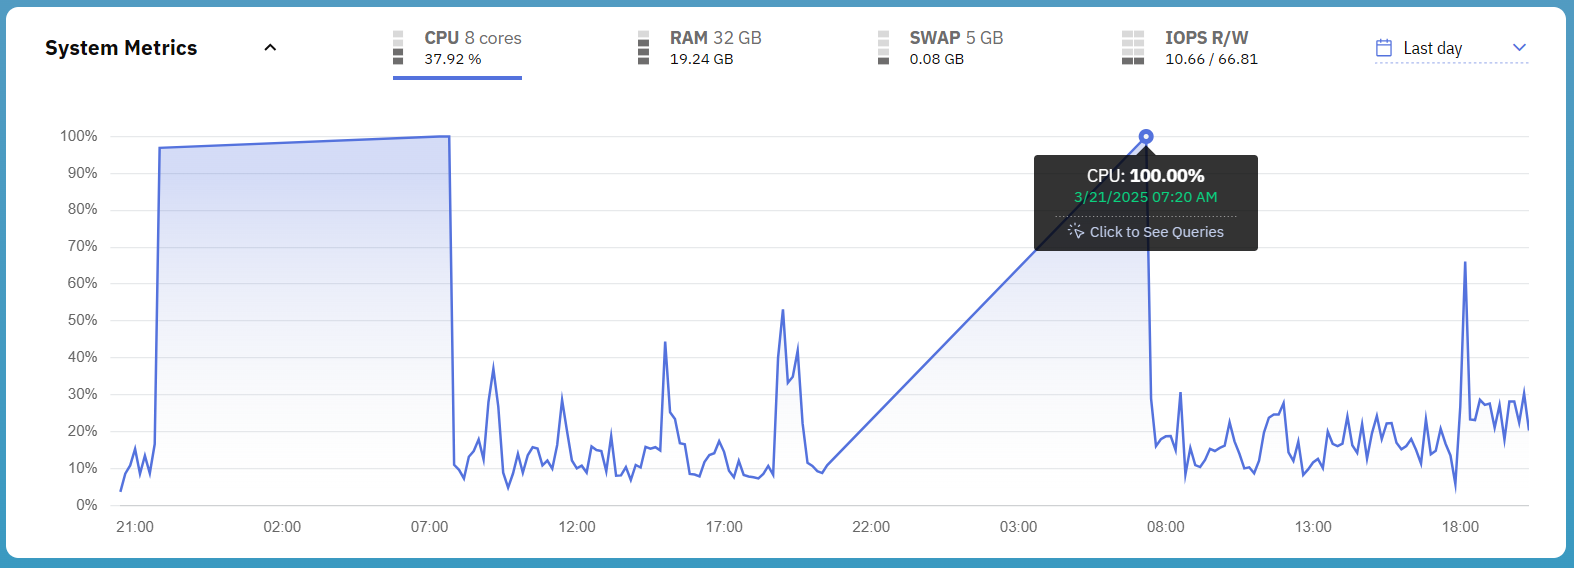
Because the JMeter tests were run sporadically on my own notebook, the timeline does not resemble what you’d have in a production system where the database is always available and serving traffic continuously.
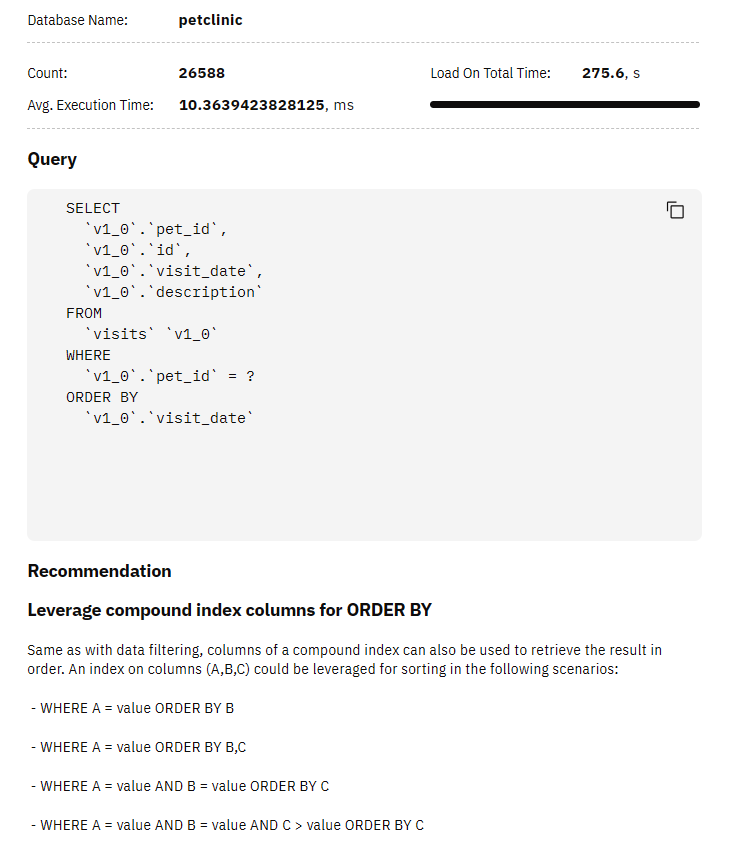
Releem aggregates the queries on the timeline and allows us to see which queries were executing during the CPU spike:

We can click on the top-most time-consuming SQL query, and Releem will provide us with an optimization recommendation:
Investigating IO spikes
Another frequent problem we could bump into when developing data-intensive applications is the IO load executed by the database when running under heavy load.
Not only do relational database systems load table and index pages from the disk and flush the modified in-memory pages to the disk during checkpoints, but the Redo Log has to be written and flushed on every transaction commit to ensure Durability (The D in ACID).
When running our JMeter tests, we can see that the MySQL database goes through several IO spikes that are correlated with our test executions:
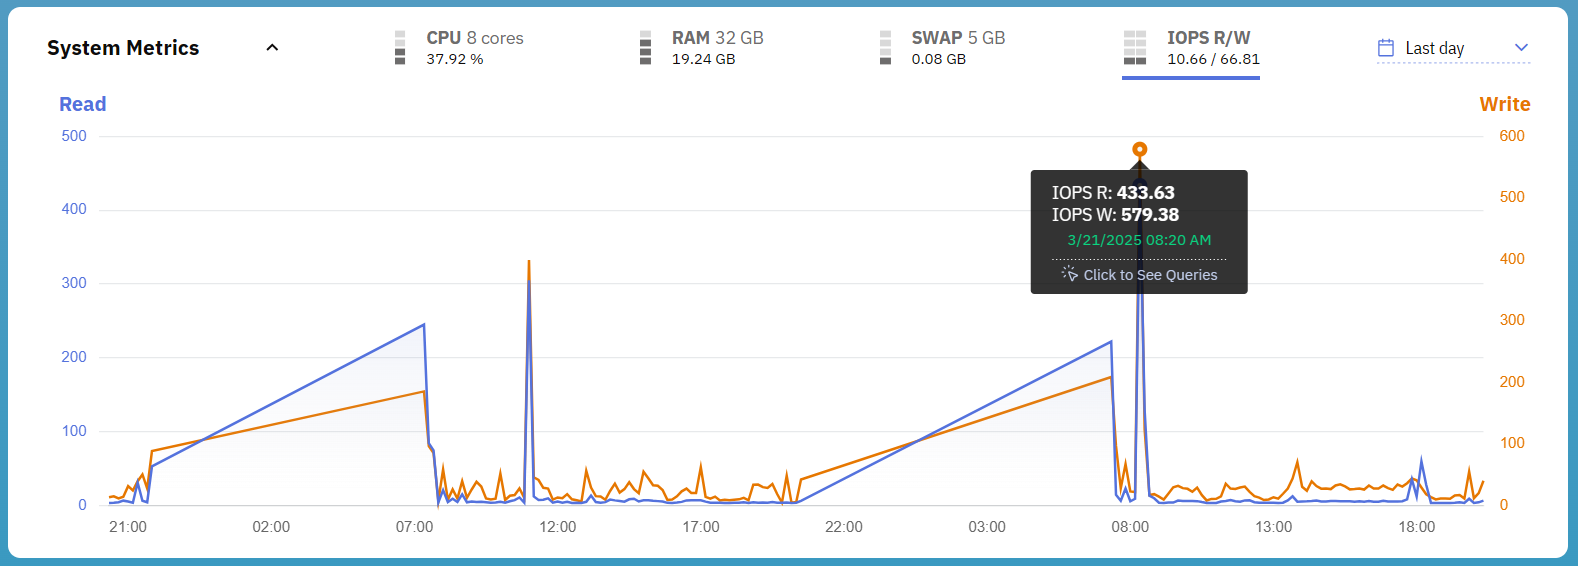
Just like it was the case with the CPU spikes, Releem allows us to click on the IO spike to see which queries were executed at that point in time:

The top-most SQL query is the same one we bump into when investigating the CPU spike, so it’s worth checking it out in more detail.
MySQL Query Optimization with Releem
While we can submit queries for optimization recommendations, Releem can also do that automatically and send a report, as illustrated by the following Events section in the Releem dashboard:

For our top-most resource-consuming query, the optimization suggestion looks as follows:
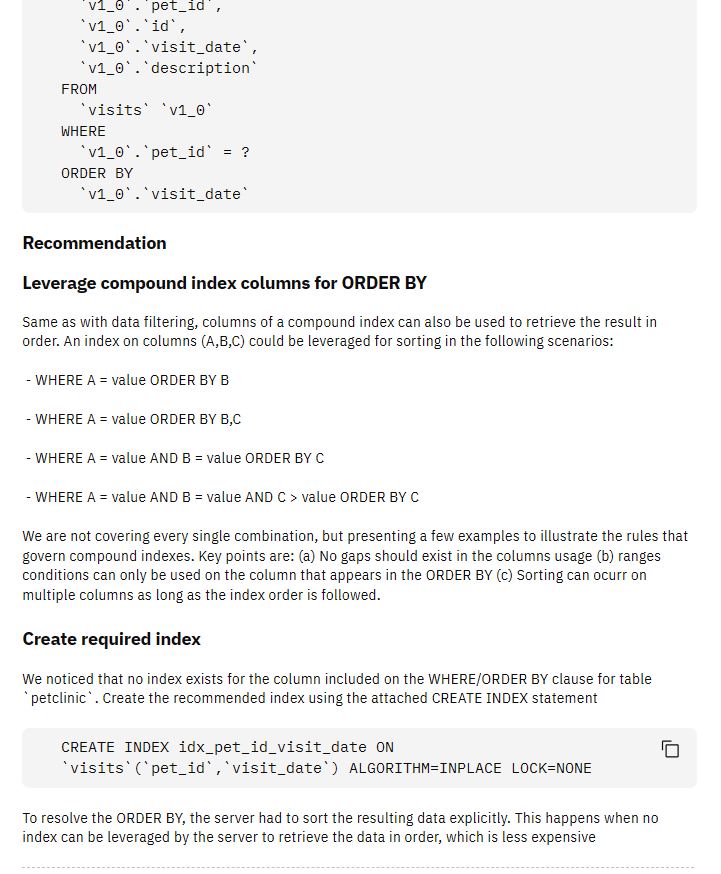
Releem is suggesting that we should create the following database index that will allow the ORDER BY clause to use the index instead of sorting the records in memory:
CREATE INDEX idx_pet_id_visit_date ON visits(pet_id, visit_date)
ALGORITHM=INPLACE LOCK=NONE
To validate this suggestion, let’s get the execution plan for this SQL query using EXPLAIN ANALYZE prior to adding the index:
-> Sort: v1_0.visit_date
   (cost=182523.91 rows=1580044)
   (actual time=9794.645..9931.562 rows=1121028 loops=1)
     -> Index lookup on v1_0 using visits_ibfk_1 (pet_id=3)
        (actual time=0.083..9187.061 rows=1121028 loops=1)
As you can see, there is an in-memory sort on 1,121,028 records, which we can avoid by creating the aforementioned database index.
After adding the index, if we rerun EXPLAIN ANALYZE, we get the following execution plan:
-> Index lookup on v1_0 using idx_pet_id_visit_date (pet_id=3)
   (cost=181258.59 rows=1580044)
   (actual time=2.049..6031.866 rows=1121028 loops=1)
Notice that there is no need for an extra Sort operation since the index can be scanned in the order required by the ORDER BY clause.
After adding the index, Releem sees that we have applied the suggested change and triggers an event to notify us:
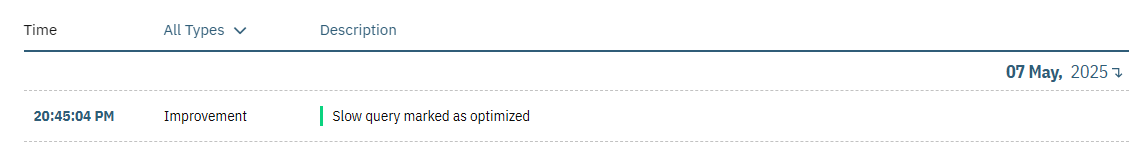
And, when going to the Query Optimization tab, we can see that our query status has changed to the status of Optimized:

And when clicking on the Optimized query, we can see the gain we’ve got by adding the idx_pet_id_visit_date database index:

However, while adding the index helps us improve performance, there’s much more we can do to optimize the execution of this SQL query.
Limiting the result set size
What’s nice about Releem is that it scans the database server continuously, and after adding the idx_pet_id_visit_date index, Releem figures out that there is a new optimization opportunity available for our long-running SQL query:

As you have noticed from the previous execution plan, the benefit of using the index is compromised by the fact that we are fetching way too many records from the table. As I explained in this article, indexing works best when selecting smaller result sets.
While adding the index helped us remove the extra Sort operation, the SQL query could be further optimized by adding a LIMIT clause since it now fetches over a million records.
So, if we add a limit clause to restrict the result size to at most 100 records:
EXPLAIN ANALYZE
SELECT
  v1_0.pet_id,
  v1_0.id,
  v1_0.visit_date,
  v1_0.description
FROM
  visits v1_0
WHERE
  v1_0.pet_id = 3
ORDER BY
  v1_0.visit_date
LIMIT 100
We can see that the execution plan now scans only 100 records, and the query execution takes only 11.129 milliseconds.
-> Limit: 100 row(s)
   (cost=178642.88 rows=100)
   (actual time=11.091..11.129 rows=100 loops=1)
     -> Index lookup on v1_0 using idx_pet_id_visit_date (pet_id=3)
        (cost=178642.88 rows=1580066)
        (actual time=11.089..11.116 rows=100 loops=1)
If you enjoyed this article, I bet you are going to love my Book and Video Courses as well.


Conclusion
If you are using MySQL or MariaDB, Releem can help you monitor the database server and provide you with configuration options and query tuning recommendations.
By scanning the database continuously, Releem is a great tool in your DevOps toolkit. So, if you are using MySQL or MariaDB and want to boost application performance, then you should definitely give it a try.
This research was funded by Releem and conducted in accordance with the blog ethics policy.
While the article was written independently and reflects entirely my opinions and conclusions, the amount of work involved in making this article happen was compensated by Releem.